VDB 113
(van den Bergh 113; vdBergh 113; MWSC 2819)
0.76
UTI
0.75
CN
0.67
Cdens
1.0
CC3
0.68
Clit
1.0
Cdup
Nm (P>50%)
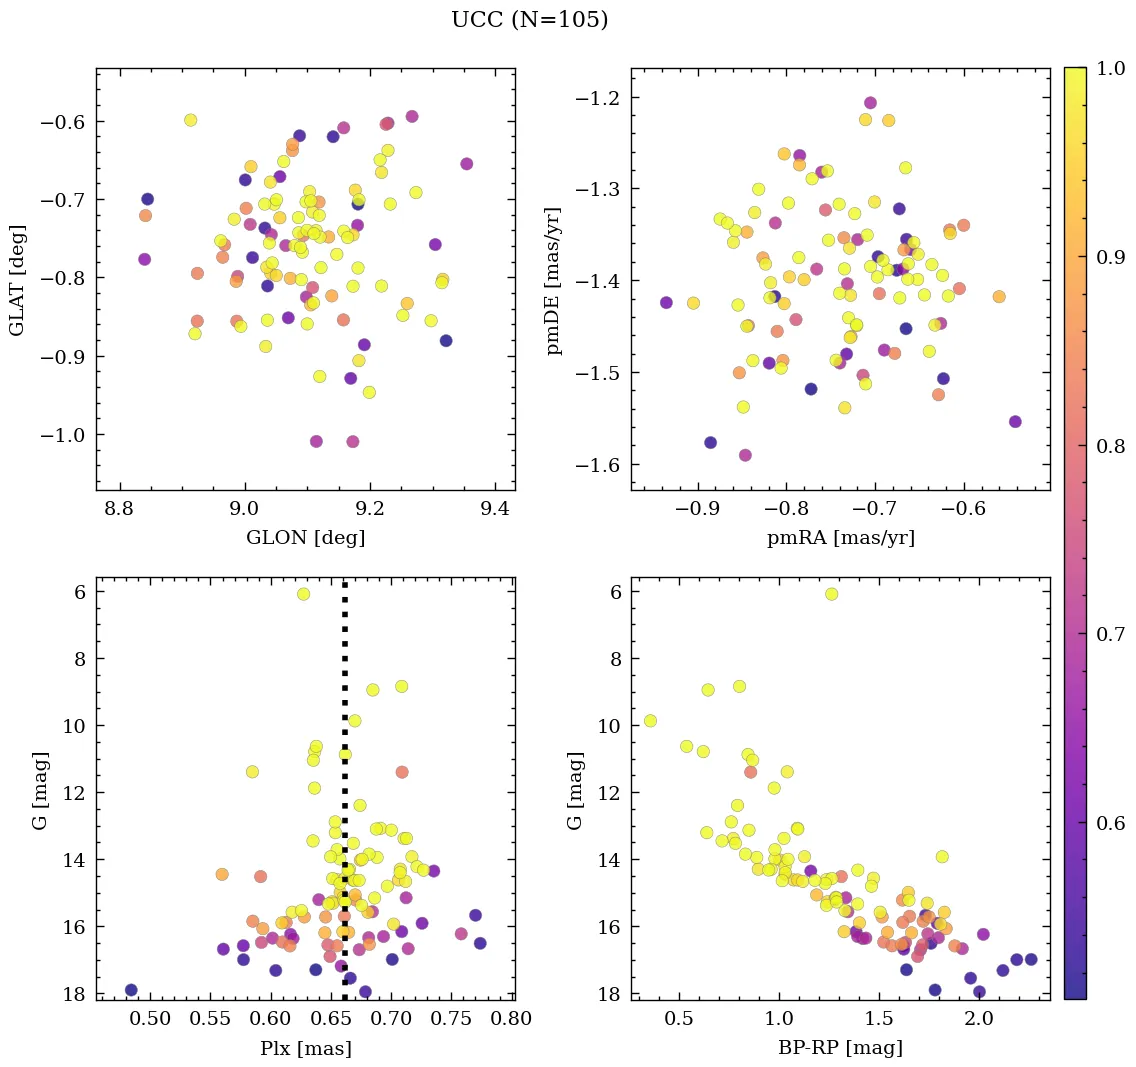
105
Core radius and density
1.8 [pc], 3.3 [pc-2]
- CN 0.75 Rich
- Cdens 0.67 Moderately dense
- CC3 1.0 Very high quality
- Clit 0.68 Moderately studied
- Cdup 1.0 Unique
 MOCA
MOCA
Overview
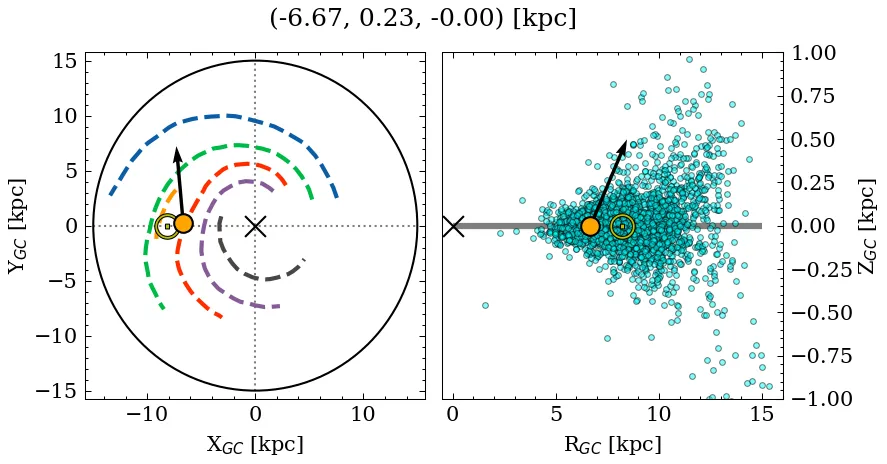
VDB 113 is a rich, moderately dense object of very high C3 quality. Its parallax locates it at a relatively close distance, near the mid-plane, affected by moderate extinction. It is catalogued as a very massive, near-solar metallicity, young cluster, but with a large variance across recent sources for the age parameter (see Parameters). It is moderately studied in the literature.
Note: This object shares a significant percentage of members with 2 later reported entries. See table with shared members information.
Data
| Reference | Year | RA [deg] | DEC [deg] | Plx [mas] | pmRA [mas/yr] | pmDE [mas/yr] | Rv [km/s] |
|---|---|---|---|---|---|---|---|
| UCC | 99999– | 272.174 | -21.45 | 0.662 | -0.73 | -1.397 | -35.75 |
| Hunt & Reffert | 2024 | 272.165 | -21.441 | 0.654 | -0.719 | -1.423 | -38.175 |
| Cavallo et al. | 2024 | 272.234 | -21.453 | 0.657 | – | – | – |
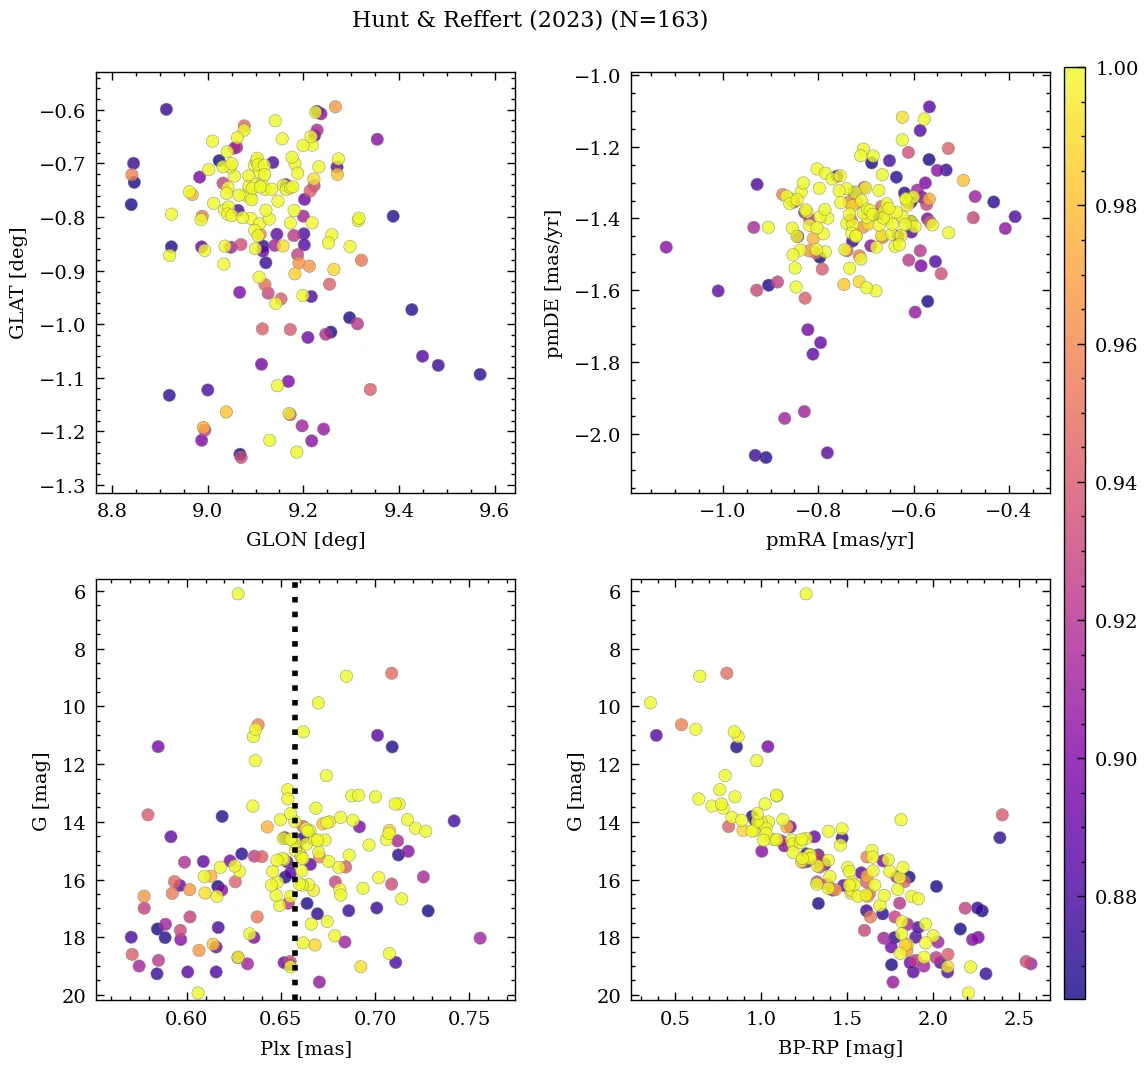
| Hunt & Reffert | 2023 | 272.165 | -21.441 | 0.654 | -0.719 | -1.423 | -38.175 |
| Just et al. | 2023 | 272.167 | -21.406 | – | – | – | – |
| Dias et al. | 2018 | – | – | – | -0.28 | -2.37 | – |
| Sampedro et al. | 2017 | 272.15 | -21.417 | – | -1.99 | -1.89 | – |
| Dias et al. | 2016 | 272.15 | -21.417 | – | -1.76 | -1.98 | -16.0 |
| Kharchenko et al. | 2016 | 272.167 | -21.406 | – | – | – | – |
| Dias et al. | 2014 | 272.15 | -21.417 | – | -1.76 | -1.98 | – |
| Kharchenko et al. | 2013 | 272.175 | -21.405 | – | -0.35 | -3.15 | -8.0 |
| Morales et al. | 2013 | 272.15 | -21.417 | – | – | – | – |
| Gozha et al. | 2012 | 272.15 | -21.417 | – | – | – | – |
| Kharchenko et al. | 2009 | 272.209 | -21.424 | – | – | – | – |
| Piskunov et al. | 2008 | 272.209 | -21.424 | – | – | – | – |
| Kharchenko et al. | 2007 | 272.14 | -21.42 | – | 0.23 | – | -16.0 |
| Piskunov et al. | 2007 | 272.209 | -21.424 | – | – | – | – |
| Kharchenko et al. | 2005 | 272.22 | -21.42 | – | -0.26 | -2.47 | -16.0 |
| Kharchenko et al. | 2003 | 272.17 | -21.44 | – | -0.42 | -2.3 | – |
| Dias et al. | 2002 | 272.15 | -21.45 | – | – | – | – |
| Lynga | 1987 | 272.15 | -21.462 | – | – | – | – |
💡 Note: The UCC values are estimated from its identified members.
| Reference | Year | Dist [kpc] | Av [mag] | DAv [mag] | Age [Myr] | [Fe/H] [dex] | Mass [Msun] | Bfrac | BSS |
|---|---|---|---|---|---|---|---|---|---|
| UCC | 99999– | 2.06 | 1.83 | 2.65 | 32 | -0.358 | 6471 | – | – |
| Hunt & Reffert | 2024 | 1.41 | 1.96 | 2.65 | 35 | – | 742(1) | – | – |
| Cavallo et al. | 2024 | 1.19 | 2.53 | – | 50 | -0.160 | – | – | – |
| Hunt & Reffert | 2023 | 1.41 | 1.96 | 2.65 | 35 | – | – | – | – |
| Just et al. | 2023 | – | – | – | 200 | – | 484 | – | – |
| Dias et al. | 2016 | 3.47 | 1.83 | – | 32 | -0.358 | – | – | – |
| Kharchenko et al. | 2016 | 2.06 | 3.28 | – | 200 | – | – | – | – |
| Kharchenko et al. | 2013 | 2.06 | 3.28 | – | 200 | -0.358 | – | – | – |
| Morales et al. | 2013 | 3.47 | – | – | 32 | – | – | – | – |
| Gozha et al. | 2012 | 1.67 | – | – | 32 | – | 69183 | – | – |
| Kharchenko et al. | 2009 | 3.47 | 1.83 | – | 32 | – | – | – | – |
| Piskunov et al. | 2008 | 3.47 | 1.83 | – | 32 | – | 45186(1) | – | – |
| Piskunov et al. | 2007 | 3.47 | 1.83 | – | 32 | – | 6471 | – | – |
| Kharchenko et al. | 2005 | 3.47 | 1.83 | – | 32 | – | – | – | – |
| Kharchenko et al. | 2003 | 1.67 | 0.79 | – | – | – | – | – | – |
(N): Indicates that there are N extra values assigned to this parameter in the corresponding reference.
Palma et al. (2025)
Part of multiple system G54, along with HSC_118, CWNU_482 and CWNU_2597.
Cavallo et al. (2024)
Gold sample.
Hunt & Reffert (2024)
Classified as open cluster. CMD class: 0.15 (50th percentile).
Hunt & Reffert (2023)
Classified as open cluster. CMD class: 0.15 (50th percentile).
Morales et al. (2013)
Classified as morphological type 'OC2' (totally exposed cluster without correlation with ATLASGAL emission). Morphological flag: one or a few submm emission within the cluster area.