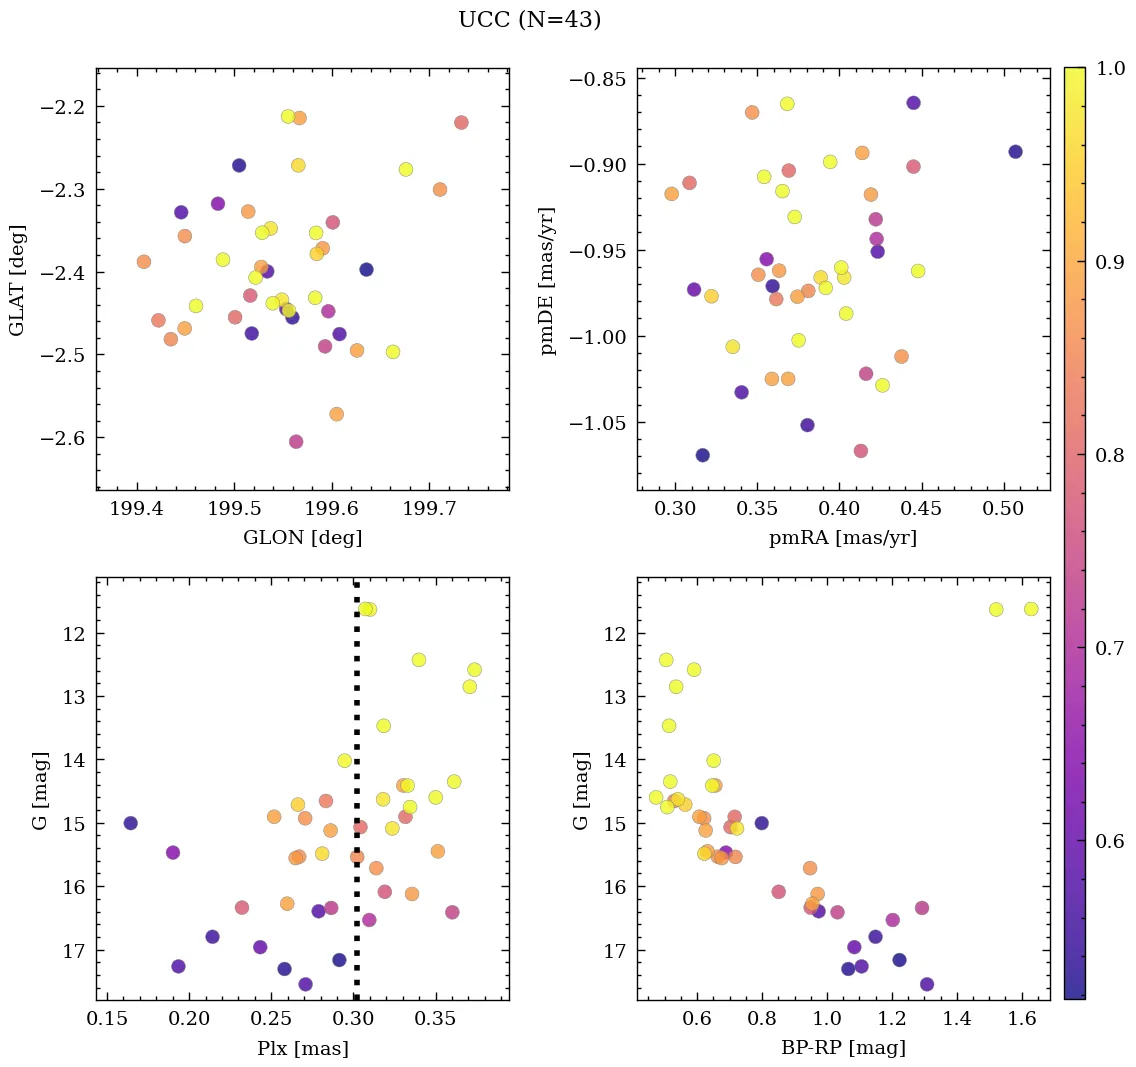
UBC 439
0.47
UTI
0.43
CN
0.07
Cdens
0.75
CC3
0.55
Clit
1.0
Cdup
Nm (P>50%)
43
Core radius and density
3.8 [pc], 0.3 [pc-2]
- CN 0.43 Poorly populated
- Cdens 0.07 Very loose
- CC3 0.75 High quality
- Clit 0.55 Moderately studied
- Cdup 1.0 Unique
 MOCA
MOCA
Overview
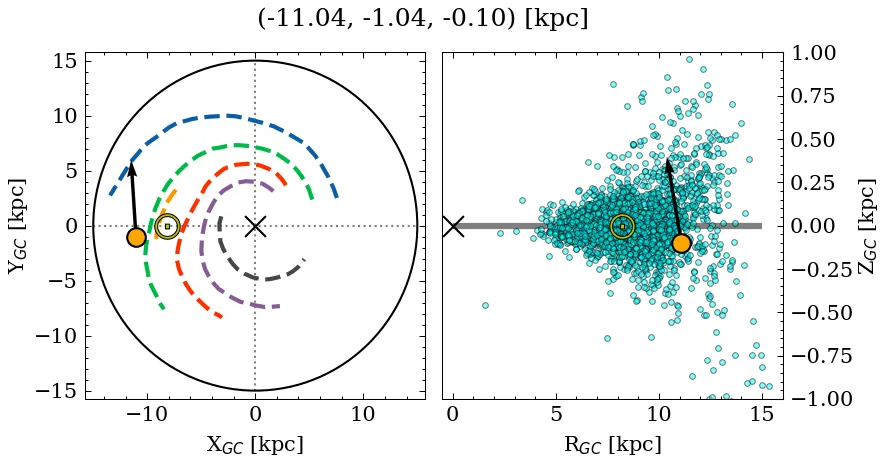
UBC 439 is a poorly populated, very loose object of high C3 quality. Its parallax locates it at a moderate distance, below the mid-plane, affected by moderate extinction. It is catalogued as a near-solar metallicity, intermediate-age cluster (see Parameters). It is moderately studied in the literature.
Data
| Reference | Year | RA [deg] | DEC [deg] | Plx [mas] | pmRA [mas/yr] | pmDE [mas/yr] | Rv [km/s] |
|---|---|---|---|---|---|---|---|
| UCC | 99999– | 94.49 | 10.753 | 0.302 | 0.375 | -0.965 | 34.231 |
| Li et al. | 2026 | 94.53 | 10.75 | – | – | – | – |
| Li et al. | 2025 | 94.541 | 10.752 | 0.303 | 0.417 | -0.944 | – |
| Almeida et al. | 2025 | 94.546 | 10.766 | – | – | – | – |
| Zhang et al. | 2024 | 94.47 | 10.753 | – | – | – | – |
| Hunt & Reffert | 2024 | 94.47 | 10.753 | 0.297 | 0.376 | -0.963 | 34.242 |
| Cavallo et al. | 2024 | 94.543 | 10.724 | 0.3 | – | – | – |
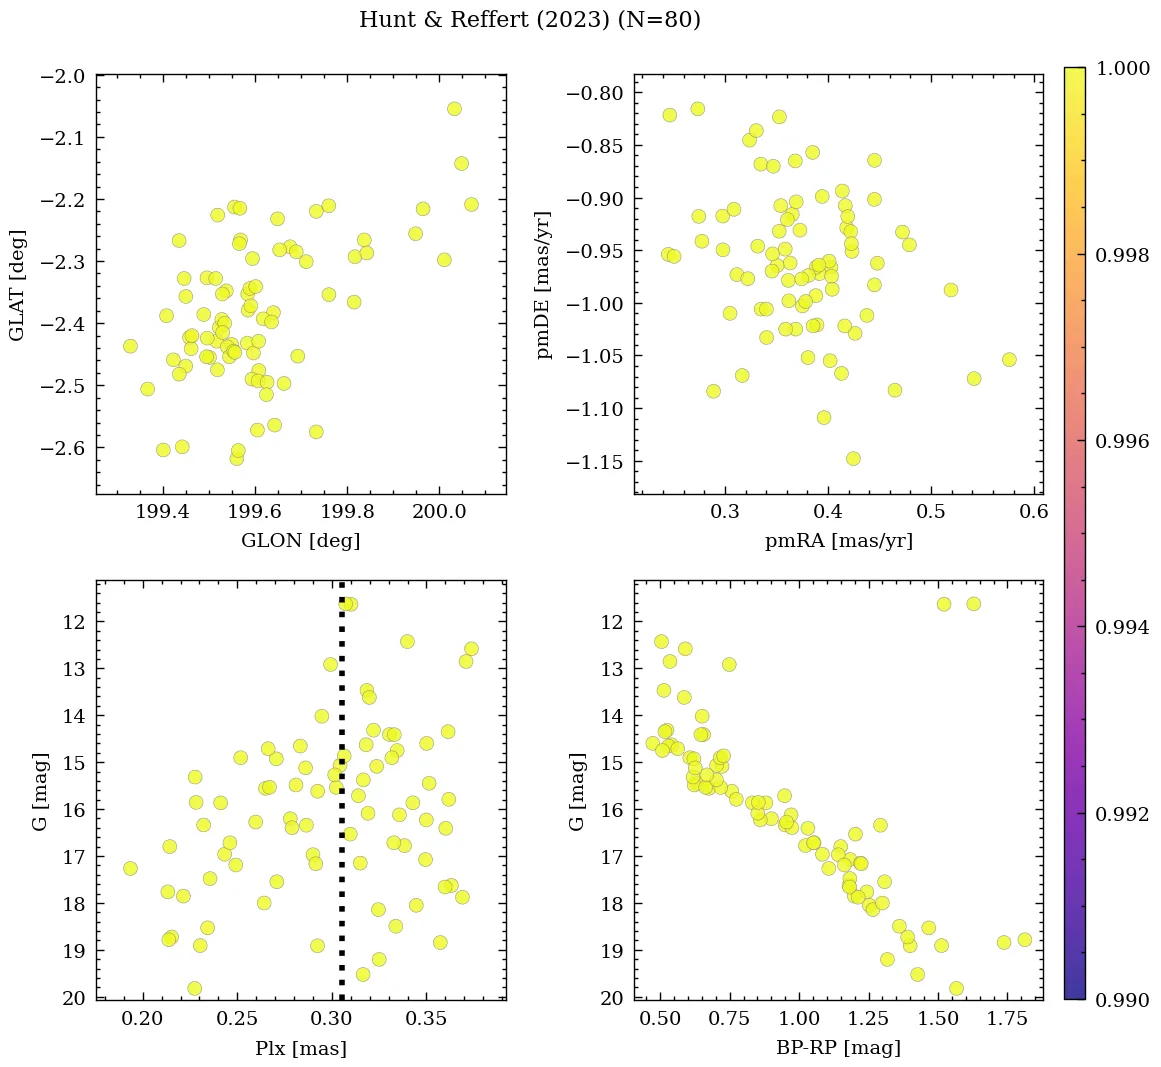
| Hunt & Reffert | 2023 | 94.47 | 10.753 | 0.297 | 0.376 | -0.963 | 34.242 |
| Almeida et al. | 2023 | 94.544 | 10.761 | – | – | – | – |
| Jadhav & Subramaniam | 2021 | 94.541 | 10.752 | – | – | – | – |
| Dias et al. | 2021 | 94.546 | 10.766 | 0.282 | 0.443 | -0.95 | – |
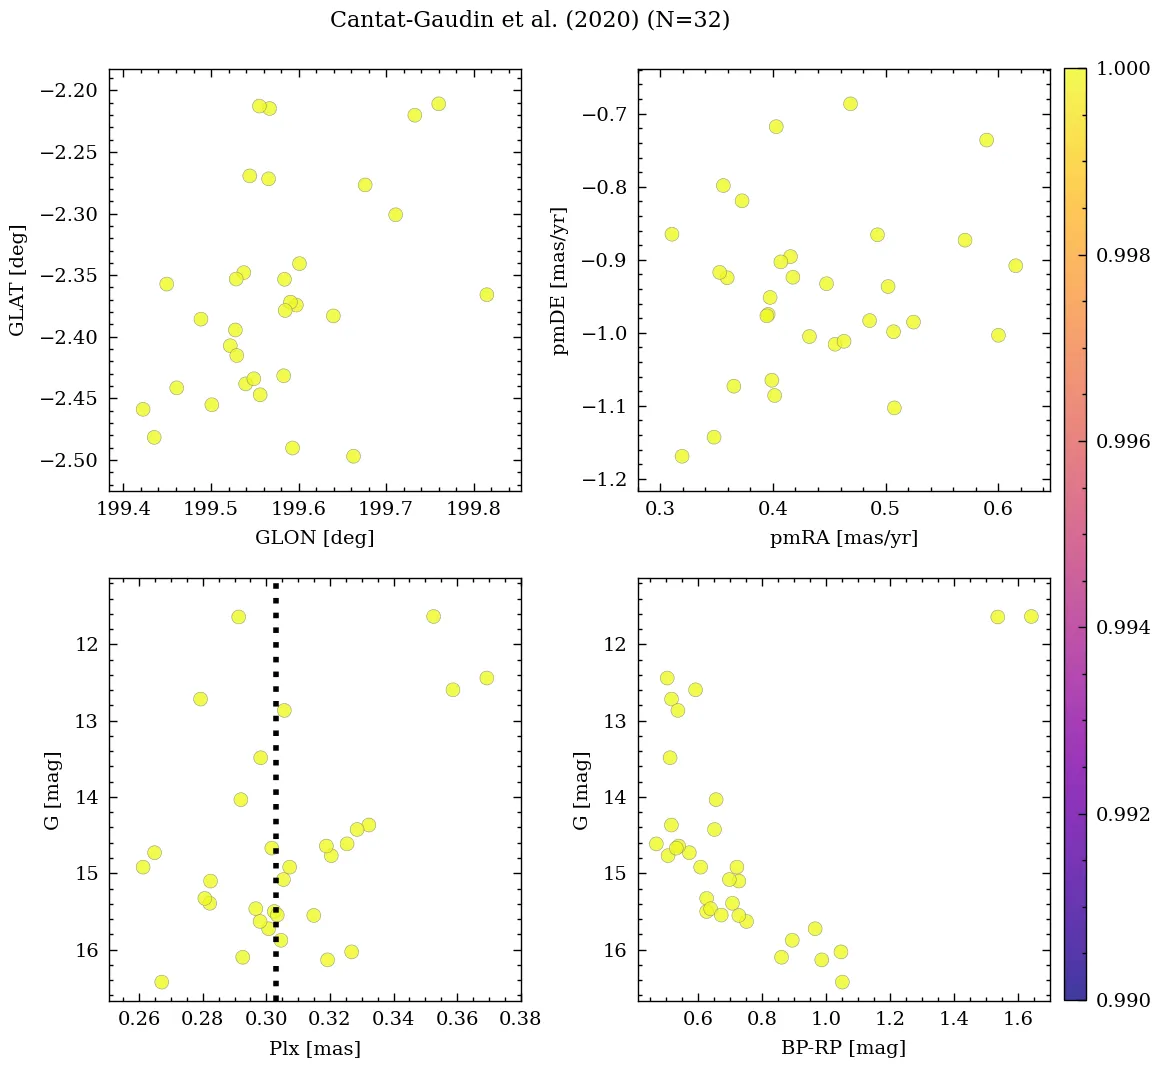
| Cantat-Gaudin et al. | 2020 | 94.541 | 10.752 | 0.303 | 0.417 | -0.944 | – |
| Castro-Ginard et al. | 2020 | 94.548 | 10.753 | 0.306 | 0.44 | -0.945 | – |
💡 Note: The UCC values are estimated from its identified members.
| Reference | Year | Dist [kpc] | Av [mag] | DAv [mag] | Age [Myr] | [Fe/H] [dex] | Mass [Msun] | Bfrac | BSS |
|---|---|---|---|---|---|---|---|---|---|
| UCC | 99999– | 2.77 | 1.325 | 0.82 | 280 | -0.175 | 450 | 0.5 | 0 |
| Li et al. | 2025 | 2.76 | 1.26 | – | 323 | -0.158 | – | – | – |
| Almeida et al. | 2025 | 2.77 | 1.40 | – | 280 | – | 524 | – | – |
| Zhang et al. | 2024 | – | – | – | – | -0.254(1) | – | – | – |
| Hunt & Reffert | 2024 | 2.83 | 1.07 | 0.82 | 225 | – | 429(1) | – | – |
| Cavallo et al. | 2024 | 2.74 | 1.65 | – | 209 | -0.380 | – | – | – |
| Hunt & Reffert | 2023 | 2.83 | 1.07 | 0.82 | 225 | – | – | – | – |
| Almeida et al. | 2023 | 2.57 | 1.39 | – | 287 | -0.175 | 471(1) | 0.50 | – |
| Jadhav & Subramaniam | 2021 | 3.06 | 0.81 | – | 355 | – | 254 | – | 0(1) |
| Dias et al. | 2021 | 2.77 | 1.40 | – | 280 | -0.146 | – | – | – |
| Cantat-Gaudin et al. | 2020 | 3.06 | 0.81 | – | 355 | – | – | – | – |
| Kounkel et al. | 2020 | 2.27 | 1.51 | – | 182 | – | – | – | – |
(N): Indicates that there are N extra values assigned to this parameter in the corresponding reference.
Li et al. (2026)
Tidal & Core radii: r_t=157+/-68.3 [pc], r_c=0.27+/-0.0 [pc]; stars within r_t: N~54
Almeida et al. (2025)
Mass determination: intermediate fit. Isochrone match: good fit. Silver sample.
Cavallo et al. (2024)
Gold sample.
Hunt & Reffert (2024)
Classified as open cluster. CMD class: 1.00 (50th percentile).
Hunt & Reffert (2023)
Classified as open cluster. CMD class: 1.00 (50th percentile).