Trumpler 21
(Collinder 274; VDBH 148; MWSC 2131; OCL 903; vdBergh-Hagen 148; ESO 096 15; FoF 2099)
0.90
UTI
0.76
CN
1.0
Cdens
0.75
CC3
1.0
Clit
1.0
Cdup
Stellar density (N50/rad)
64.8 [N/pc2]
- CN 0.76 Rich
- Cdens 1.0 Very dense
- CC3 0.75 High quality
- Clit 1.0 Very well-studied
- Cdup 1.0 Unique
 MOCA
MOCA
Overview
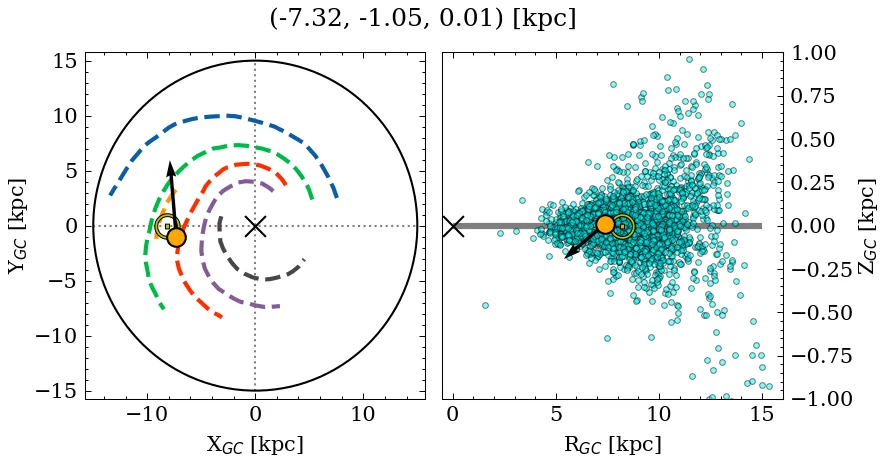
Trumpler 21 is a rich, very dense object of high C3 quality. Its parallax locates it at a relatively close distance, near the mid-plane, affected by low extinction. It is catalogued as a near-solar metallicity, young cluster, but with a large variance across recent sources for the metallicity and mass parameters (see Parameters). It is very well-studied in the literature.
Data
| Reference | Year | RA [deg] | DEC [deg] | Plx [mas] | pmRA [mas/yr] | pmDE [mas/yr] | Rv [km/s] |
|---|---|---|---|---|---|---|---|
| UCC | 99999– | 203.057 | -62.787 | 0.736 | -4.708 | -2.258 | -13.411 |
| Li et al. | 2025 | 203.068 | -62.787 | 0.722 | -4.682 | -2.312 | – |
| Wei et al. | 2025 | 203.048 | -62.785 | 0.738 | -4.707 | -2.259 | – |
| Almeida et al. | 2025 | 203.067 | -62.789 | – | – | – | – |
| Hunt & Reffert | 2024 | 203.055 | -62.781 | 0.726 | -4.719 | -2.267 | -14.672 |
| Cavallo et al. | 2024 | 203.048 | -62.791 | 0.731 | – | – | – |
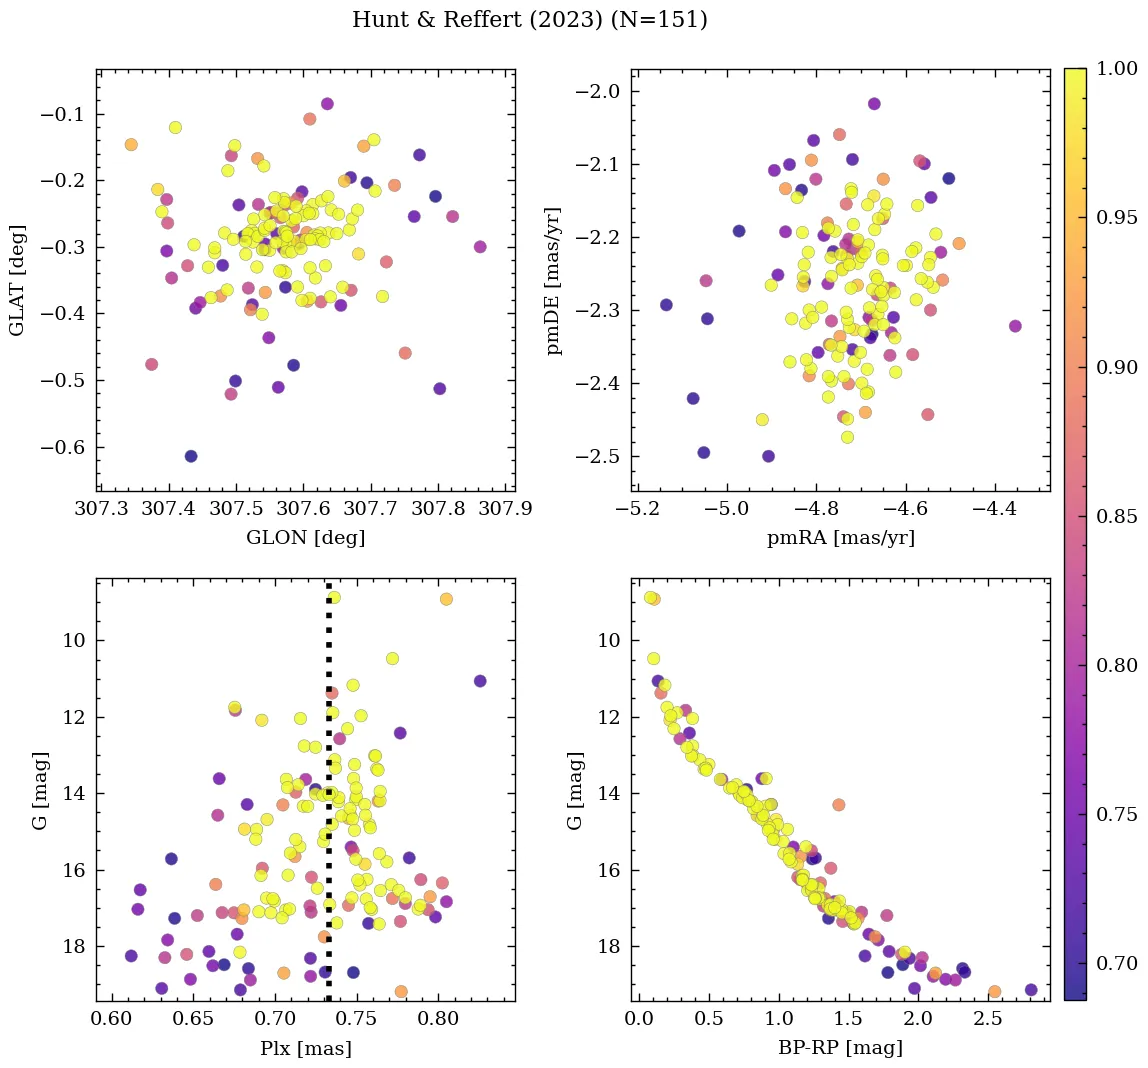
| Hunt & Reffert | 2023 | 203.055 | -62.781 | 0.726 | -4.719 | -2.267 | -14.672 |
| Almeida et al. | 2023 | 203.057 | -62.792 | – | – | – | – |
| Cordoni et al. | 2023 | 203.067 | -62.789 | 0.725 | -4.667 | -2.293 | – |
| Just et al. | 2023 | 203.043 | -62.797 | – | – | – | – |
| Jaehnig et al. | 2021 | 203.073 | -62.788 | 0.756 | -4.671 | -2.313 | – |
| Rain et al. | 2021 | 203.068 | -62.787 | 0.722 | -4.682 | -2.312 | – |
| Richer et al. | 2021 | 203.044 | -62.786 | 0.728 | -4.681 | -2.302 | – |
| Dias et al. | 2021 | 203.067 | -62.789 | 0.725 | -4.667 | -2.293 | – |
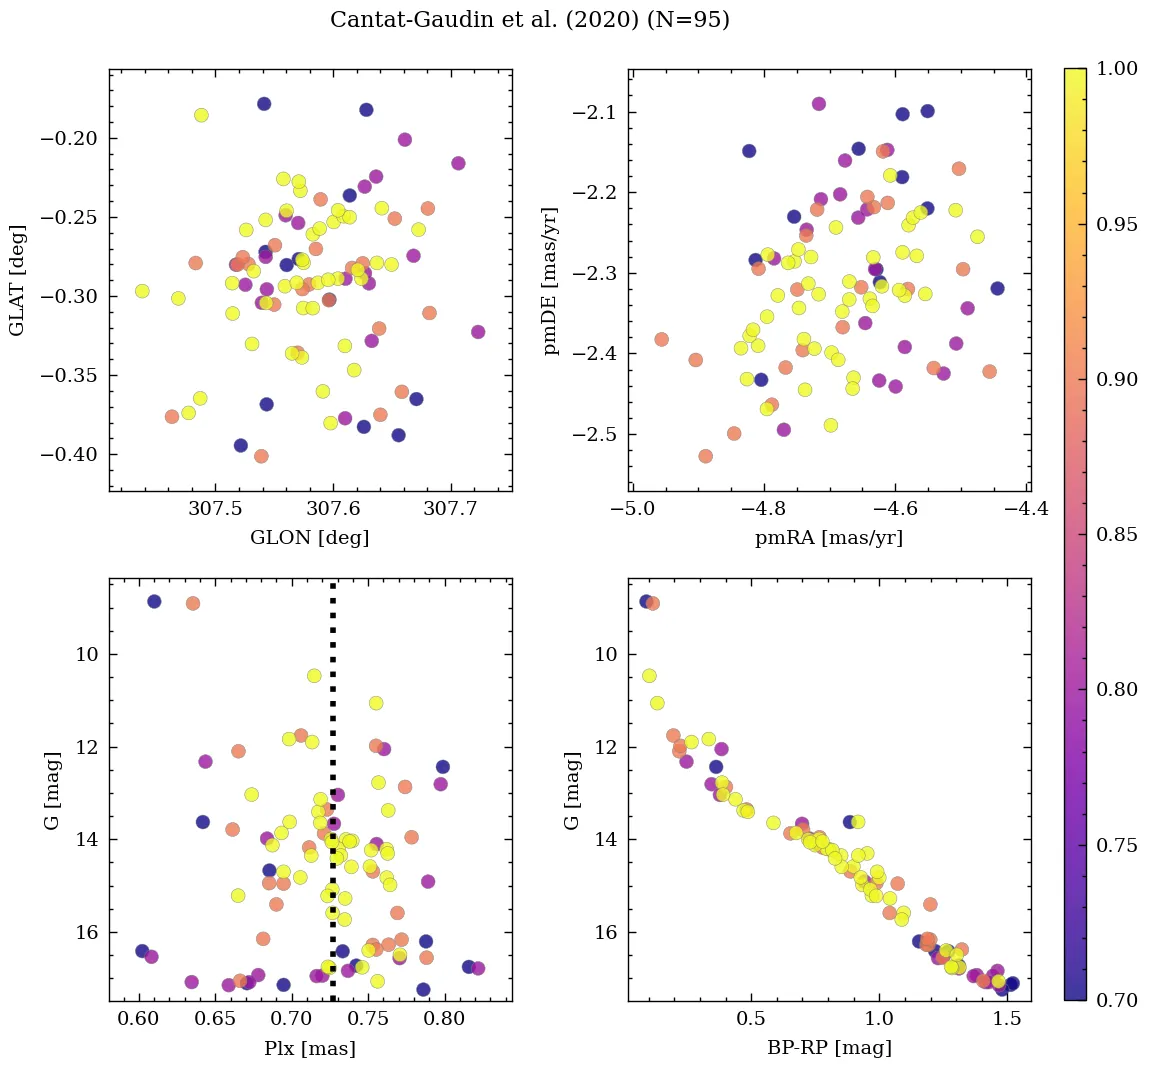
| Cantat-Gaudin et al. | 2020 | 203.068 | -62.787 | 0.722 | -4.682 | -2.312 | – |
| Cantat-Gaudin & Anders | 2020 | 203.068 | -62.787 | 0.722 | -4.682 | -2.312 | – |
| Liu & Pang | 2019 | 203.066 | -62.787 | 0.728 | -4.674 | -2.273 | – |
| Bossini et al. | 2019 | 203.068 | -62.787 | – | – | – | – |
| Bica et al. | 2019 | 203.043 | -62.784 | – | – | – | – |
| Cantat-Gaudin et al. | 2018 | 203.068 | -62.787 | 0.722 | -4.682 | -2.312 | – |
| Loktin & Popova | 2017 | 203.055 | -62.8 | – | -8.459 | -2.734 | -32.9 |
| Kharchenko et al. | 2016 | 203.043 | -62.797 | – | – | – | – |
| Dias et al. | 2014 | 203.058 | -62.8 | – | -3.57 | -3.34 | – |
| Kharchenko et al. | 2013 | 203.055 | -62.8 | – | -10.4 | -4.5 | -32.9 |
| Morales et al. | 2013 | 203.058 | -62.8 | – | – | – | – |
| Piskunov et al. | 2008 | 203.047 | -62.794 | – | – | – | – |
| Ahumada & Lapasset | 2007 | 203.05 | -62.8 | – | – | – | – |
| van den Bergh | 2006 | 203.05 | -62.8 | – | – | – | – |
| Kharchenko et al. | 2005 | 203.05 | -62.8 | – | -10.41 | -4.77 | – |
| Kharchenko et al. | 2003 | 203.05 | -62.78 | – | -11.09 | -1.86 | – |
| Dias et al. | 2002 | 203.058 | -62.8 | – | -3.62 | -3.36 | – |
| Dambis | 1999 | 203.05 | -62.8 | – | – | – | – |
| Lynga | 1987 | 203.05 | -62.804 | – | – | – | – |
| van den Bergh & Hagen | 1975 | 202.2 | -62.533 | – | – | – | – |
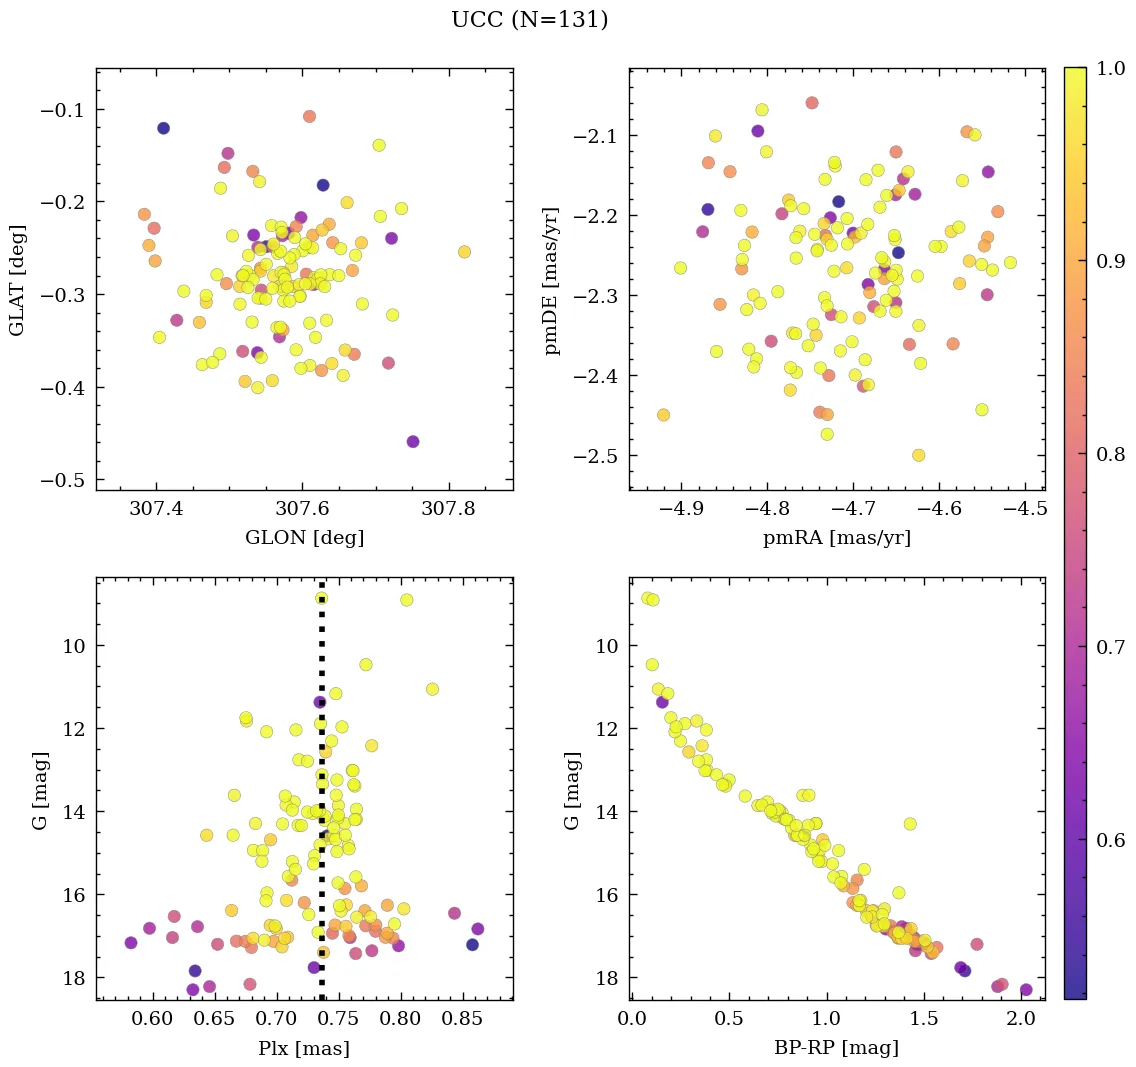
💡 Note: The UCC values are estimated from its identified members.
| Reference | Year | Dist [kpc] | Av [mag] | DAv [mag] | Age [Myr] | [Fe/H] [dex] | Mass [Msun] | Bfrac | BSS |
|---|---|---|---|---|---|---|---|---|---|
| UCC | 99999– | 1.28 | 0.725 | 0.66 | 51 | 0.036 | 436 | 0.33 | 0 |
| Li et al. | 2025 | 1.10 | 0.75 | – | 58 | -0.256 | – | – | – |
| Wei et al. | 2025 | 1.72 | 1.00 | – | 44 | 0.000 | 597 | 0.31 | – |
| Almeida et al. | 2025 | 1.28 | 0.85 | – | 51 | – | 343 | – | – |
| Hunt & Reffert | 2024 | – | – | – | – | – | 528(1) | – | – |
| Cavallo et al. | 2024 | 1.14 | 1.02 | – | 69 | -0.450 | – | – | – |
| Hunt & Reffert | 2023 | 1.28 | 0.60 | 0.66 | 95 | – | – | – | – |
| Almeida et al. | 2023 | 1.26 | 0.83 | – | 63 | 0.073 | 253(1) | 0.51 | – |
| Cordoni et al. | 2023 | 1.28 | 0.85 | – | 51 | 0.138 | 2163 | 0.33 | 0(1) |
| Just et al. | 2023 | – | – | – | 71 | – | 81 | – | – |
| Tarricq et al. | 2022 | 1.29 | – | – | 51 | – | – | – | – |
| Jaehnig et al. | 2021 | 1.33(1) | – | – | – | – | – | – | – |
| Rain et al. | 2021 | 1.33 | 0.73 | – | 49 | – | – | – | 0 |
| Richer et al. | 2021 | – | 0.84 | – | 49 | – | – | – | – |
| Dias et al. | 2021 | 1.28 | 0.85 | – | 51 | 0.138 | – | – | – |
| Cantat-Gaudin et al. | 2020 | 1.32 | 0.58 | – | 49 | – | – | – | – |
| Kounkel et al. | 2020 | 1.30 | 0.86 | – | 72 | – | – | – | – |
| Cantat-Gaudin & Anders | 2020 | 1.33 | – | – | – | – | – | – | – |
| Liu & Pang | 2019 | – | – | – | 33 | 0.500 | – | – | – |
| Bossini et al. | 2019 | 1.29 | 0.72 | – | 49 | 0.000 | – | – | – |
| Cantat-Gaudin et al. | 2018 | 1.33 | – | – | – | – | – | – | – |
| Loktin & Popova | 2017 | 1.32 | 0.59 | – | 54 | – | – | – | – |
| Kharchenko et al. | 2016 | 1.27 | 0.79 | – | 71 | – | – | – | – |
| Kharchenko et al. | 2013 | 1.27 | 0.79 | – | 71 | – | – | – | – |
| Morales et al. | 2013 | 1.26 | – | – | 50 | – | – | – | – |
| Piskunov et al. | 2008 | 1.31 | 0.57 | – | 58 | – | – | – | – |
| Ahumada & Lapasset | 2007 | – | 0.63 | – | 50 | – | – | – | 0 |
| van den Bergh | 2006 | 1.26 | 0.63 | – | 50 | – | – | – | – |
| Kharchenko et al. | 2005 | 1.31 | 0.57 | – | 58 | – | – | – | – |
| Kharchenko et al. | 2003 | 1.26 | 0.63 | – | – | – | – | – | – |
| Dias et al. | 2002 | 1.26 | 0.62 | – | 50 | – | – | – | – |
| Dambis | 1999 | 1.13 | 0.68 | – | 40 | – | – | – | – |
| Lynga | 1987 | 1.10 | 0.63 | – | 63 | – | – | – | – |
(N): Indicates that there are N extra values assigned to this parameter in the corresponding reference.
Almeida et al. (2025)
Mass determination: good fit. Isochrone match: good fit.
Cavallo et al. (2024)
Gold sample.
Hunt & Reffert (2024)
Classified as open cluster. CMD class: 1.00 (50th percentile).
Richer et al. (2021)
The expected number of WDs is 0.45, 0 WD candidates found, and 0 WD candidates found in the wide search.
Rain et al. (2021)
This cluster was include in (Dias et al., 2002A&A...389..871D, Cat. B/ocl) however, parameters log(t)=7.690, Av=0.723, [Fe/H]=0.000 were taken from Bossini et al. (2019A&A...623A.108B, Cat. J/A+A/623/A108). The distance d=1174.4 (dmode+01) of Cantat-Gaudin et al. (2018A&A...618A..93C, Cat. J/A+A18/A93) was use to fit the isochrone.
Morales et al. (2013)
Classified as morphological type 'OC2' (totally exposed cluster without correlation with ATLASGAL emission). Morphological flag: exposed cluster, with submm emission not associated with the cluster.