Tombaugh 2
(Haffner 2; MWSC 1076; OCL 605; ESO 558 07; FSR 1250)
0.95
UTI
1.0
CN
1.0
Cdens
0.75
CC3
1.0
Clit
1.0
Cdup
Stellar density (N50/rad)
42.3 [N/pc2]
- CN 1.0 Very rich
- Cdens 1.0 Very dense
- CC3 0.75 High quality
- Clit 1.0 Very well-studied
- Cdup 1.0 Unique
 MOCA
MOCA
Overview
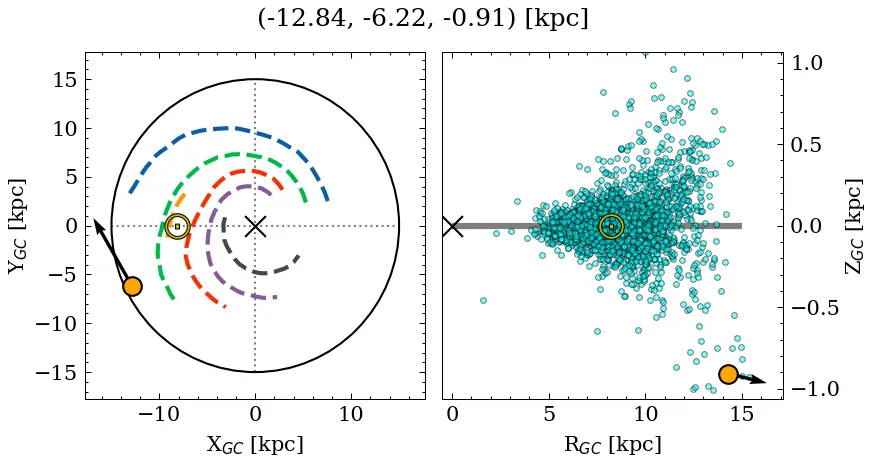
Tombaugh 2 is a very rich, very dense object of high C3 quality. Its parallax locates it at a large distance, well below the mid-plane, affected by low extinction. It is catalogued as a very massive, near-solar metallicity, old cluster, but with a large variance across recent sources for the metallicity and mass parameters (see Parameters). It is very well-studied in the literature.
Note: This object contains blue stragglers according to at least one source.
Data
| Reference | Year | RA [deg] | DEC [deg] | Plx [mas] | pmRA [mas/yr] | pmDE [mas/yr] | Rv [km/s] |
|---|---|---|---|---|---|---|---|
| UCC | 99999– | 105.777 | -20.818 | 0.107 | -0.511 | 1.401 | 122.805 |
| Otto et al. | 2026 | 105.777 | -20.817 | – | -0.46 | 1.35 | 121.5 |
| Guerco et al. | 2025 | 106.0 | -20.8 | 0.07 | -0.51 | 1.47 | 121.0 |
| Hu & Soubiran | 2025 | 105.778 | -20.814 | – | – | – | – |
| Almeida et al. | 2025 | 105.772 | -20.819 | – | – | – | – |
| Hunt & Reffert | 2024 | 105.777 | -20.817 | 0.114 | -0.511 | 1.409 | 119.628 |
| Cavallo et al. | 2024 | 105.778 | -20.814 | 0.112 | – | – | – |
| Hunt & Reffert | 2023 | 105.777 | -20.817 | 0.114 | -0.511 | 1.409 | 119.628 |
| Just et al. | 2023 | 105.766 | -20.813 | – | – | – | – |
| Perren et al. | 2022 | 105.773 | -20.82 | – | – | – | – |
| Jadhav & Subramaniam | 2021 | 105.773 | -20.82 | – | – | – | – |
| Jaehnig et al. | 2021 | 105.773 | -20.82 | 0.107 | -0.508 | 1.366 | – |
| Netopil et al. | 2022 | 105.771 | -20.817 | – | – | – | 122.47 |
| Rain et al. | 2021 | 105.773 | -20.82 | 0.079 | -0.464 | 1.349 | – |
| Dias et al. | 2021 | 105.772 | -20.819 | 0.085 | -0.457 | 1.351 | 114.337 |
| Cantat-Gaudin et al. | 2020 | 105.773 | -20.82 | 0.079 | -0.464 | 1.349 | – |
| Cantat-Gaudin & Anders | 2020 | 105.773 | -20.82 | 0.079 | -0.464 | 1.349 | – |
| Bica et al. | 2019 | 105.77 | -20.815 | – | – | – | – |
| Cantat-Gaudin et al. | 2018 | 105.773 | -20.82 | 0.079 | -0.464 | 1.349 | – |
| Dias et al. | 2018 | – | – | – | 0.73 | 0.39 | – |
| Sampedro et al. | 2017 | 105.771 | -20.817 | -3.04 | 4.0 | – | – |
| Kharchenko et al. | 2016 | 105.766 | -20.813 | – | – | – | – |
| Netopil et al. | 2016 | 105.771 | -20.817 | – | – | – | – |
| Dias et al. | 2014 | 105.771 | -20.817 | – | -1.72 | 3.86 | – |
| Kharchenko et al. | 2013 | 105.771 | -20.815 | – | 1.7 | 2.01 | 125.0 |
| Gozha et al. | 2012 | 105.771 | -20.817 | – | – | – | – |
| Bukowiecki et al. | 2011 | 105.779 | -20.816 | – | – | – | – |
| Kharchenko et al. | 2007 | 105.76 | -20.82 | – | 0.03 | – | – |
| Ahumada & Lapasset | 2007 | 105.775 | -20.817 | – | – | – | – |
| van den Bergh | 2006 | 105.85 | -20.85 | – | – | – | – |
| Chen et al. | 2003 | 105.77 | -20.815 | – | – | – | – |
| Dias et al. | 2002 | 105.771 | -20.817 | – | -1.72 | 3.86 | 120.9 |
| Lynga | 1987 | 105.842 | -20.859 | – | – | – | – |
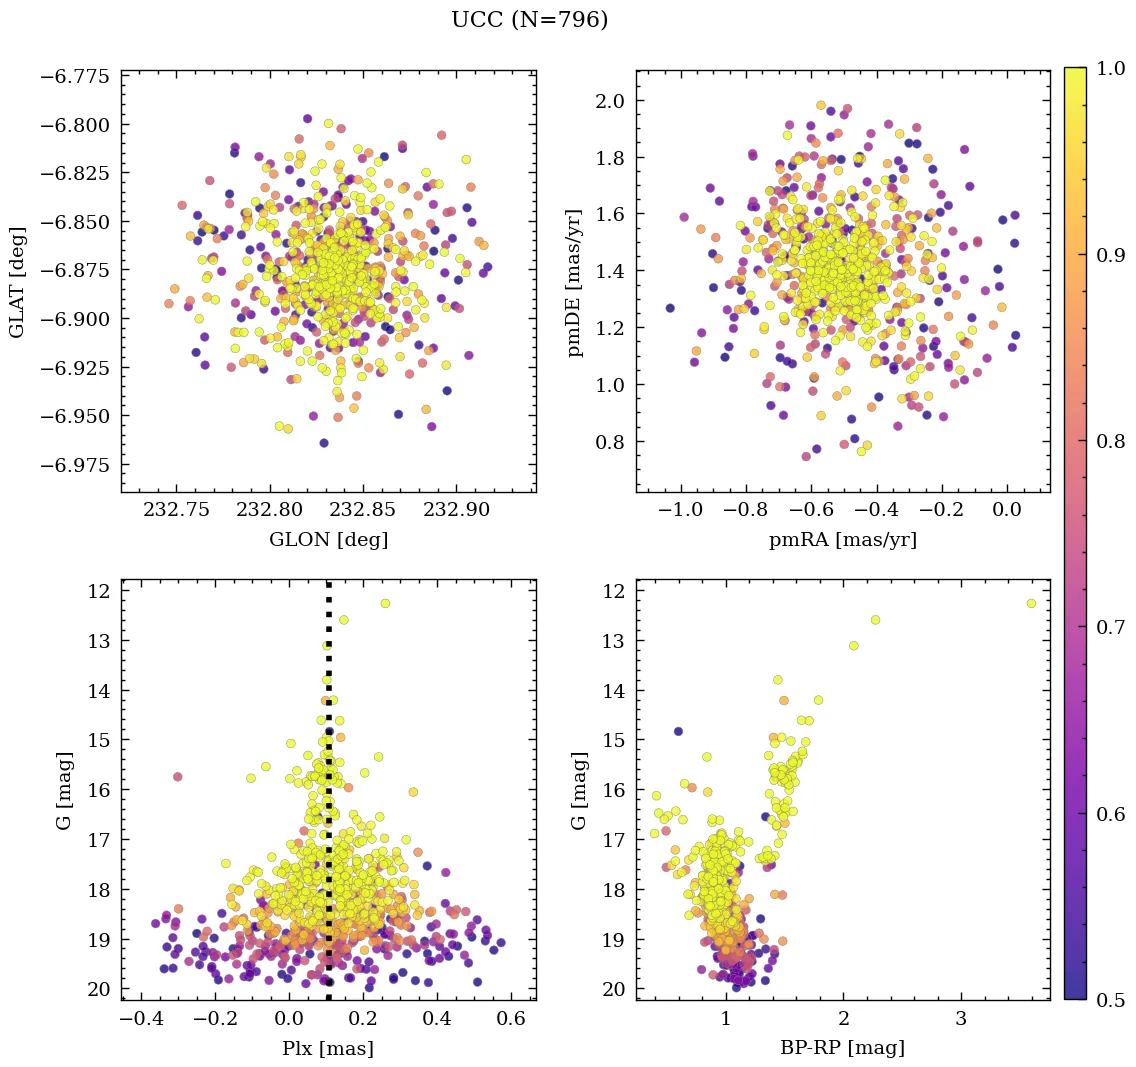
💡 Note: The UCC values are estimated from its identified members.
| Reference | Year | Dist [kpc] | Av [mag] | DAv [mag] | Age [Myr] | [Fe/H] [dex] | Mass [Msun] | Bfrac | BSS |
|---|---|---|---|---|---|---|---|---|---|
| UCC | 99999– | 8.98 | 0.89 | 1.82 | 1621 | -0.350 | 8478 | 0.45 | 17 |
| Otto et al. | 2026 | – | – | – | 1622 | -0.350(15) | – | – | – |
| Guerco et al. | 2025 | – | – | – | 1620 | -0.350 | – | – | – |
| Hu & Soubiran | 2025 | – | – | – | – | -0.400(5) | – | – | – |
| Almeida et al. | 2025 | 8.98 | 0.89 | – | 2265 | – | 8478 | – | – |
| Hunt & Reffert | 2024 | – | – | – | – | – | 4173(1) | – | – |
| Cavallo et al. | 2024 | 6.37 | 0.93 | – | 2570 | -0.370 | – | – | – |
| Hunt & Reffert | 2023 | 7.68 | 0.57 | 1.82 | 1698 | – | – | – | – |
| Just et al. | 2023 | – | – | – | 1023 | – | 2239 | – | – |
| Perren et al. | 2022 | 8.71 | 1.23 | – | 2138 | -0.480 | 21000 | 0.45 | – |
| Spina et al. | 2022 | – | – | – | – | -0.288 | – | – | – |
| Jadhav & Subramaniam | 2021 | 9.33 | 0.83 | – | 1622 | – | 8859 | – | 17(1) |
| Jaehnig et al. | 2021 | 9.81(1) | – | – | – | – | – | – | – |
| Netopil et al. | 2022 | 9.12(1) | – | – | 1995 | -0.300(1) | – | – | – |
| Rain et al. | 2021 | 9.27 | 0.95 | – | 1023 | – | – | – | 27 |
| Dias et al. | 2021 | 8.98 | 0.89 | – | 2265 | -0.178 | – | – | – |
| Cantat-Gaudin et al. | 2020 | 9.33 | 0.83 | – | 1622 | – | – | – | – |
| Kounkel et al. | 2020 | 5.98 | 0.83 | – | 1820 | – | – | – | – |
| Cantat-Gaudin & Anders | 2020 | 9.27 | – | – | – | – | – | – | – |
| Cantat-Gaudin et al. | 2018 | 9.27 | – | – | – | – | – | – | – |
| Kharchenko et al. | 2016 | 6.57 | 1.12 | – | 1023 | – | – | – | – |
| Netopil et al. | 2016 | 15.39 | – | – | 1460 | – | – | – | – |
| Kharchenko et al. | 2013 | 6.57 | 1.12 | – | 1023 | -0.310 | – | – | – |
| Gozha et al. | 2012 | 6.08 | – | – | 1023 | -0.310 | – | – | – |
| Bukowiecki et al. | 2011 | 10.38(1) | 0.47 | – | 1259 | – | – | – | – |
| Paunzen et al. | 2010 | – | – | – | – | -0.600 | – | – | – |
| Ahumada & Lapasset | 2007 | – | 0.25 | – | 1023 | – | – | – | 17 |
| van den Bergh | 2006 | 13.26 | 0.25 | – | 1023 | – | – | – | – |
| Chen et al. | 2003 | 6.30 | 1.26 | – | 4000 | -0.450(1) | – | – | – |
| Dias et al. | 2002 | 6.08 | 0.95 | – | 1023 | -0.310 | – | – | – |
(N): Indicates that there are N extra values assigned to this parameter in the corresponding reference.
Almeida et al. (2025)
Mass determination: invalid due to poor quality CMD. Isochrone match: worst fit.
Cavallo et al. (2024)
Gold sample.
Hunt & Reffert (2024)
Classified as open cluster. CMD class: 1.00 (50th percentile).
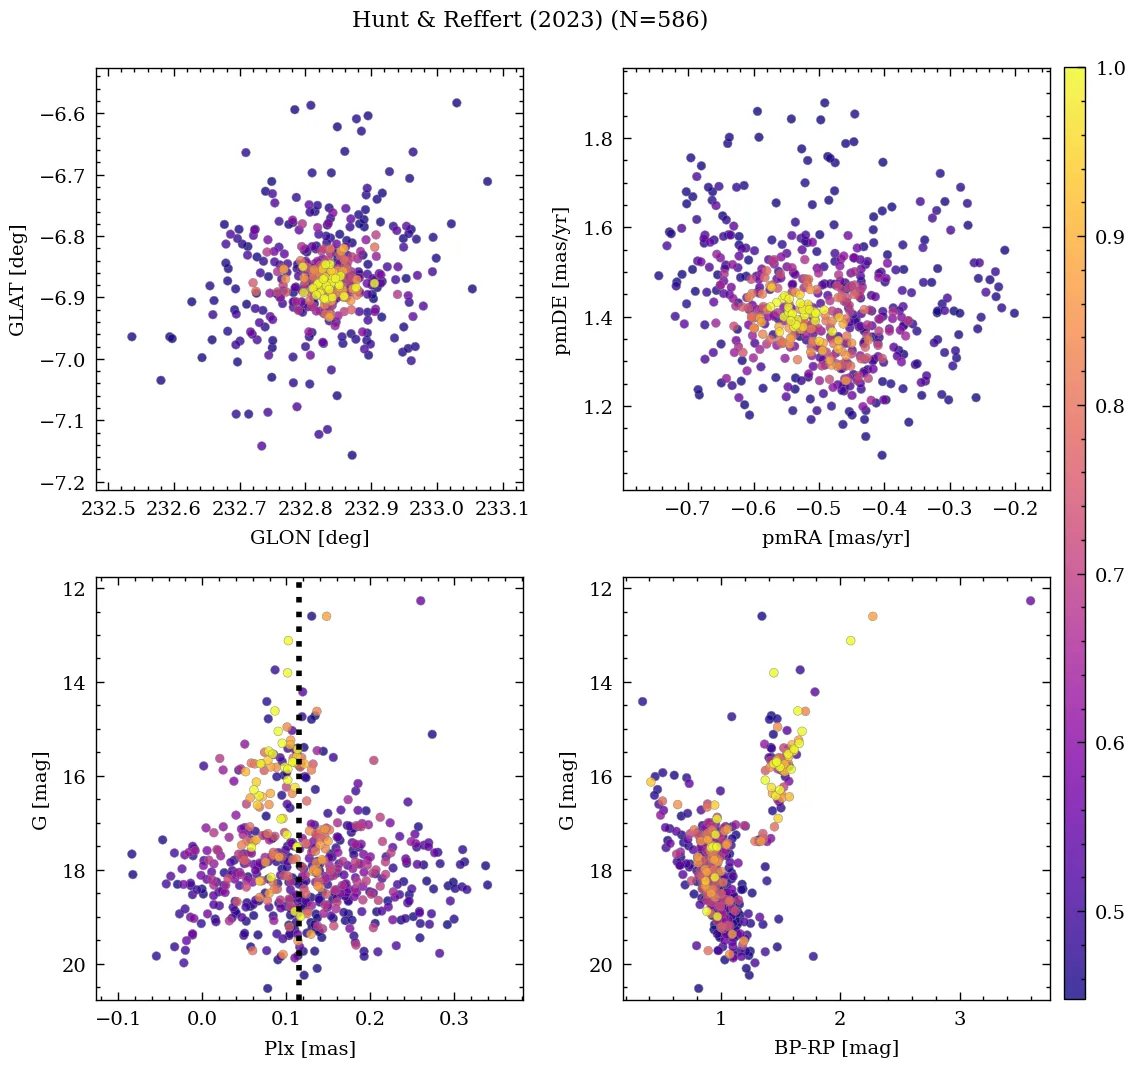
Hunt & Reffert (2023)
Classified as open cluster. CMD class: 1.00 (50th percentile).
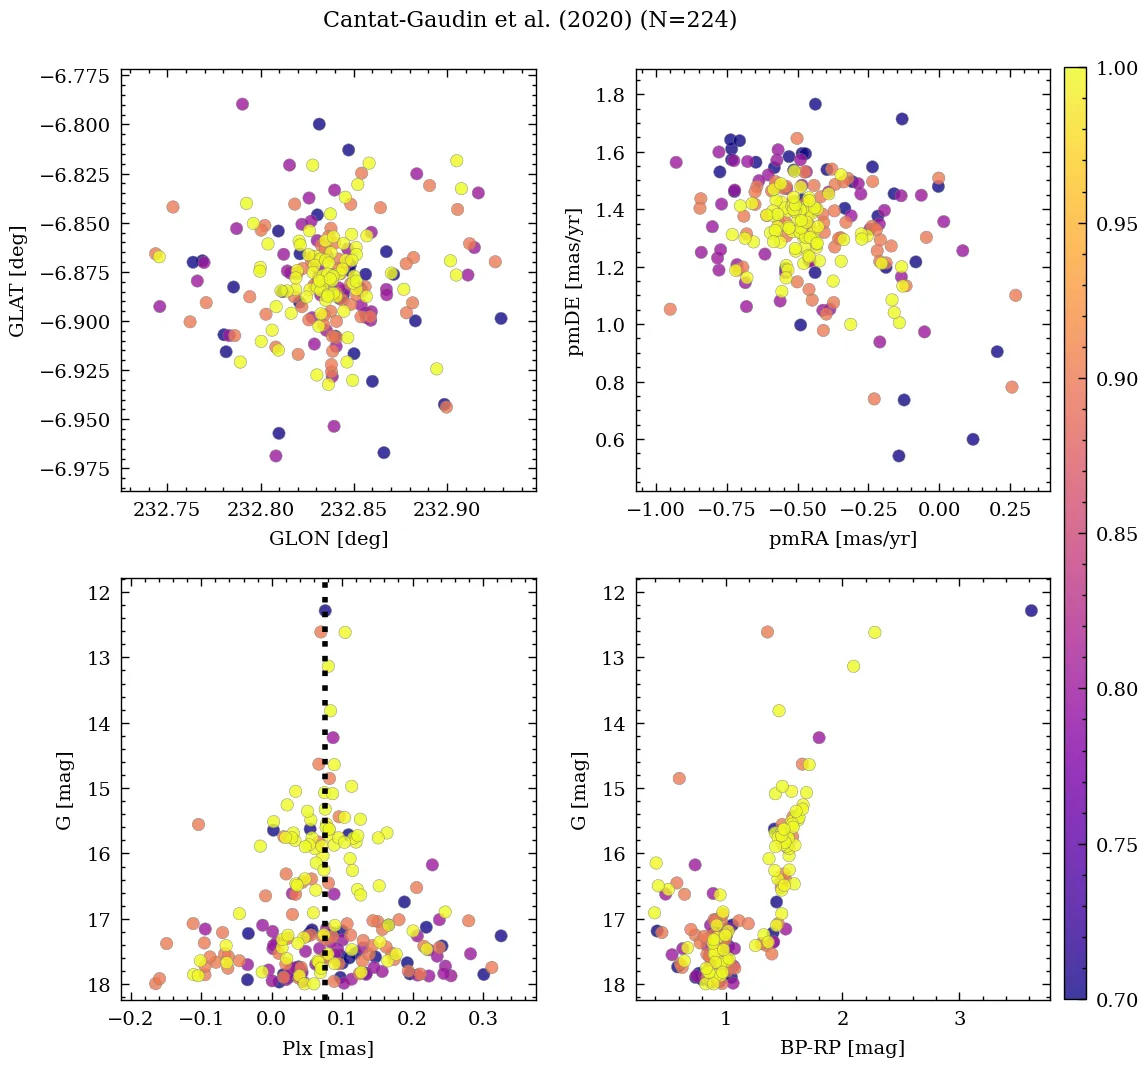
Perren et al. (2022)
A well-populated cluster with nearly 900 identified members. The CMD shows a wide main sequence, a prominent giant branch, and a clear RC; some stars above the TO are likely blue stragglers. ASteCA gives 8.7 kpc and 2.1 Gyr, close to Dias 2021 (9 kpc, 2.3 Gyr) and CG20 (9.3 kpc, 1.6 Gyr). OC02 and MWSC give distances below ~7 kpc; WEBDA gives over ~13 kpc. Frinchaboy 2008 proposed an abundance spread among members and adopted 7.9 kpc and 2.0 Gyr. Villanova 2010 places the cluster at 7.2 kpc. Kubiak 1992, studying variable stars, estimated 4 Gyr and 6.3 kpc.
Ahumada & Lapasset (2007)
Only straggler candidates inside a radius of 2' around the centre of coordinates have been considered.