Teutsch 13
(MWSC 969; DSH J0643.9+0124; FSR 1060)
0.66
UTI
0.44
CN
0.42
Cdens
1.0
CC3
0.72
Clit
1.0
Cdup
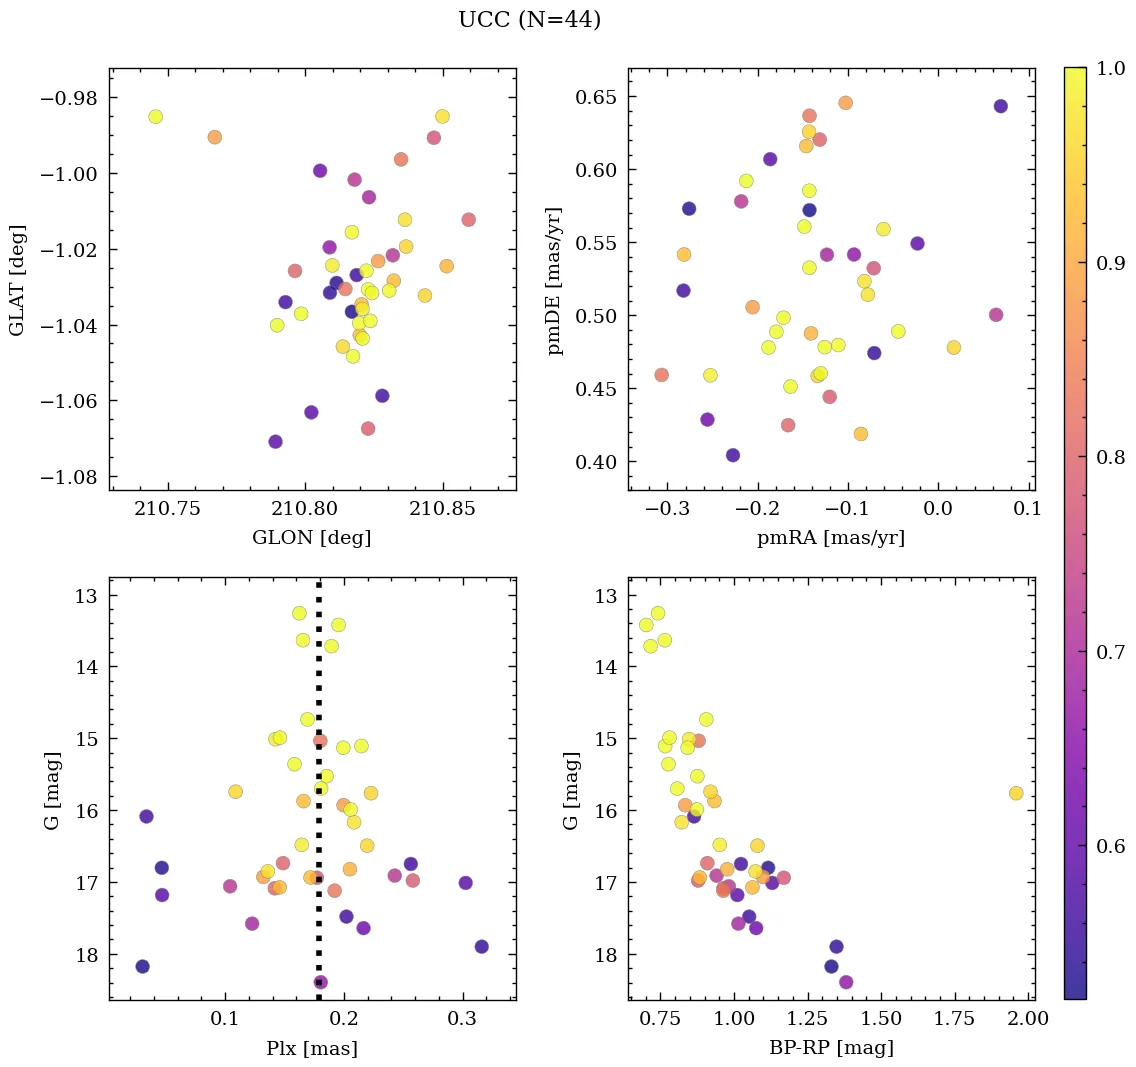
Nm (P>50%)
44
Core radius and density
1.8 [pc], 2.1 [pc-2]
- CN 0.44 Poorly populated
- Cdens 0.42 Loose
- CC3 1.0 Very high quality
- Clit 0.72 Moderately studied
- Cdup 1.0 Unique
 MOCA
MOCA
Overview
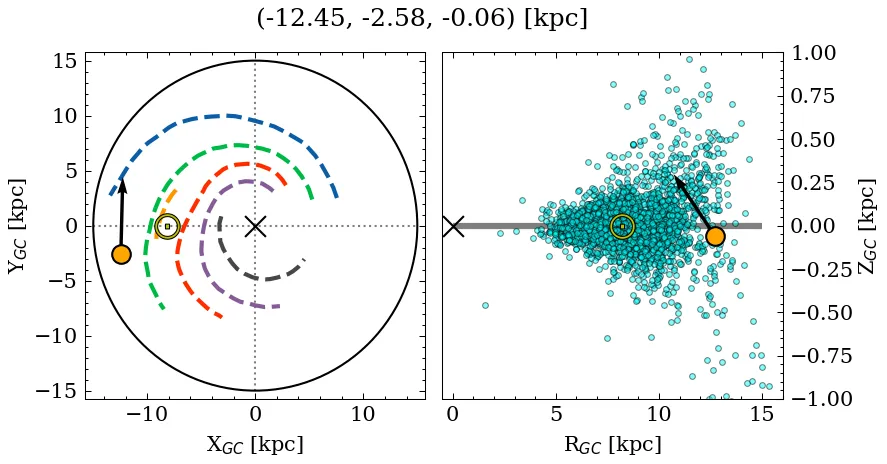
Teutsch 13 is a poorly populated, loose object of very high C3 quality. Its parallax locates it at a large distance, below the mid-plane, affected by moderate extinction. It is catalogued as a near-solar metallicity, young cluster, but with a large variance across recent sources for the age, metallicity, and mass parameters (see Parameters). It is moderately studied in the literature.
Data
| Reference | Year | RA [deg] | DEC [deg] | Plx [mas] | pmRA [mas/yr] | pmDE [mas/yr] | Rv [km/s] |
|---|---|---|---|---|---|---|---|
| UCC | 99999– | 100.98 | 1.407 | 0.179 | -0.143 | 0.515 | – |
| Almeida et al. | 2025 | 100.981 | 1.413 | – | – | – | – |
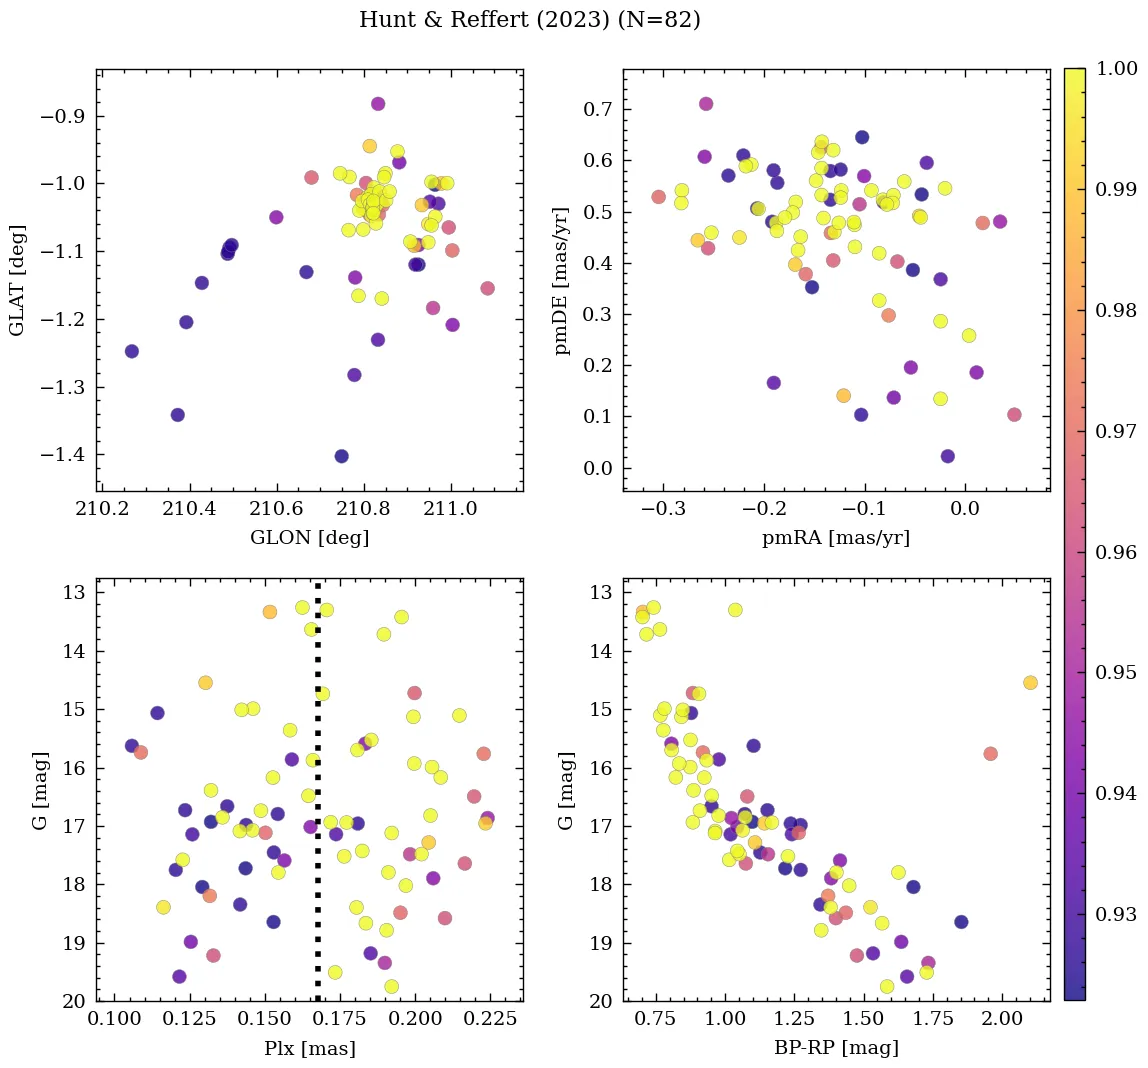
| Hunt & Reffert | 2024 | 100.976 | 1.407 | 0.171 | -0.13 | 0.452 | 100.392 |
| Celli et al. | 2024 | 100.979 | 1.403 | – | – | – | – |
| Cavallo et al. | 2024 | 100.978 | 1.38 | 0.173 | – | – | – |
| Hunt & Reffert | 2023 | 100.976 | 1.407 | 0.171 | -0.13 | 0.452 | 100.392 |
| Almeida et al. | 2023 | 100.979 | 1.414 | – | – | – | – |
| Just et al. | 2023 | 100.972 | 1.397 | – | – | – | – |
| Dias et al. | 2021 | 100.981 | 1.413 | 0.166 | -0.122 | 0.545 | – |
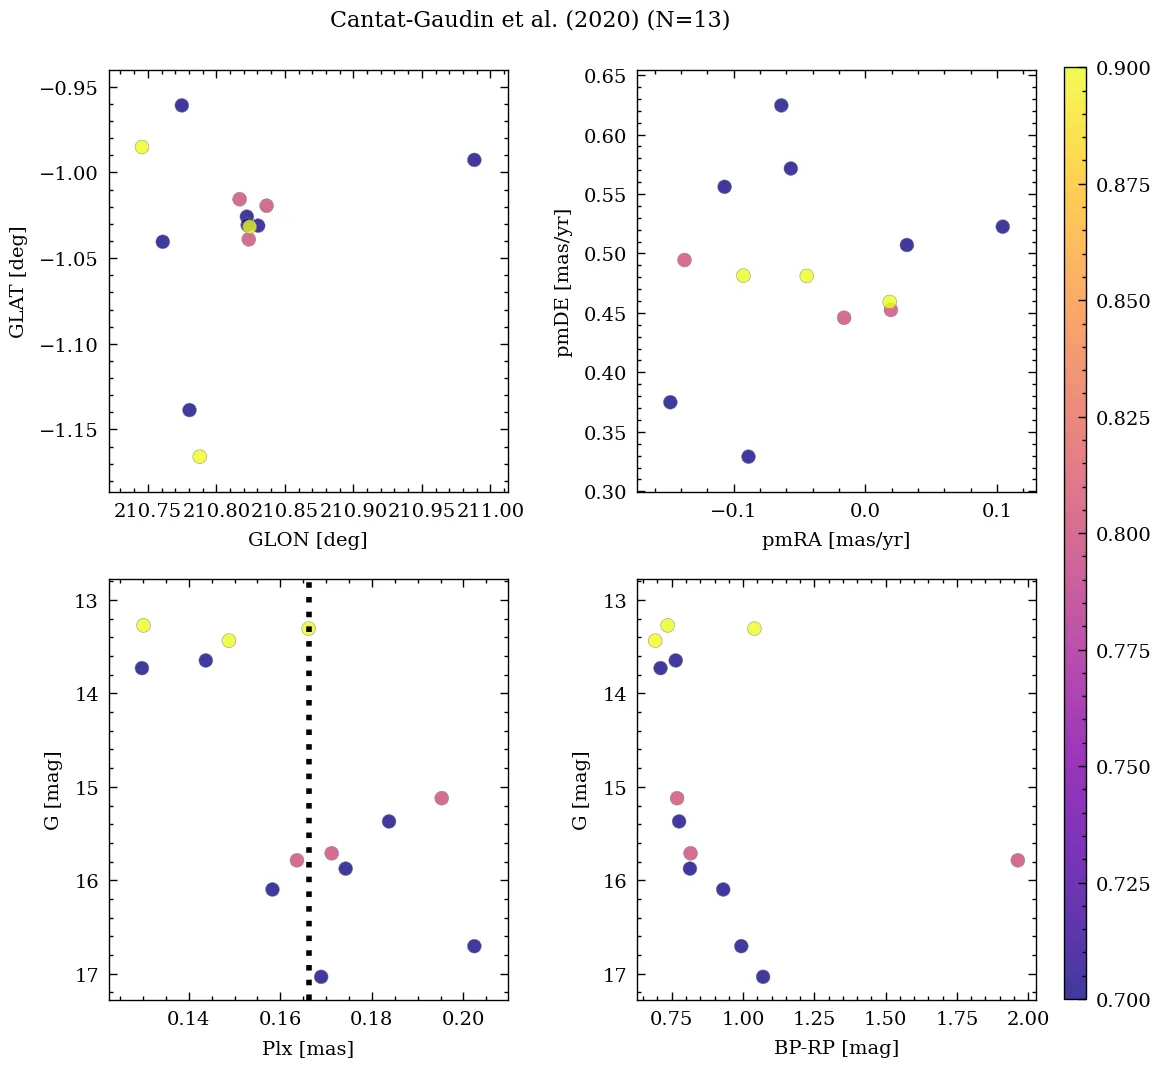
| Cantat-Gaudin et al. | 2020 | 100.984 | 1.404 | 0.155 | -0.097 | 0.518 | – |
| Zhong et al. | 2020 | 100.984 | 1.404 | – | -0.097 | 0.518 | 80.692 |
| Cantat-Gaudin & Anders | 2020 | 100.984 | 1.404 | 0.155 | -0.097 | 0.518 | – |
| Bica et al. | 2019 | 100.975 | 1.396 | – | – | – | – |
| Cantat-Gaudin et al. | 2018 | 100.984 | 1.404 | 0.155 | -0.097 | 0.518 | – |
| Loktin & Popova | 2017 | 100.98 | 1.406 | – | -0.476 | -1.093 | – |
| Sampedro et al. | 2017 | 100.979 | 1.405 | – | – | – | – |
| Dias et al. | 2016 | 100.979 | 1.405 | – | -0.92 | -1.64 | – |
| Kharchenko et al. | 2016 | 100.972 | 1.397 | – | – | – | – |
| Dias et al. | 2014 | 100.979 | 1.405 | – | -0.92 | -1.64 | – |
| Kharchenko et al. | 2013 | 100.98 | 1.395 | – | -2.64 | -3.72 | – |
| Bukowiecki et al. | 2011 | 100.987 | 1.411 | – | – | – | – |
| Kronberger et al. | 2006 | 100.979 | 1.403 | – | – | – | – |
💡 Note: The UCC values are estimated from its identified members.
| Reference | Year | Dist [kpc] | Av [mag] | DAv [mag] | Age [Myr] | [Fe/H] [dex] | Mass [Msun] | Bfrac | BSS |
|---|---|---|---|---|---|---|---|---|---|
| UCC | 99999– | 4.9 | 2.03 | 1.39 | 83 | -0.099 | 455 | 0.56 | – |
| Almeida et al. | 2025 | 3.05 | 1.83 | – | 258 | – | 97 | – | – |
| Hunt & Reffert | 2024 | 4.91 | 2.22 | 1.39 | 86 | – | 906(1) | – | – |
| Celli et al. | 2024 | – | – | – | 8 | – | 252 | – | – |
| Cavallo et al. | 2024 | 4.76 | 2.03 | – | 83 | 0.540 | – | – | – |
| Hunt & Reffert | 2023 | 4.90 | 2.22 | 1.39 | 86 | – | – | – | – |
| Almeida et al. | 2023 | 3.72 | 2.15 | – | 27 | -0.297 | 688(1) | 0.56 | – |
| Just et al. | 2023 | – | – | – | 20 | – | 455 | – | – |
| Dias et al. | 2021 | 3.05 | 1.83 | – | 258 | -0.198 | – | – | – |
| Cantat-Gaudin et al. | 2020 | 5.22 | 1.94 | – | 8 | – | – | – | – |
| Kounkel et al. | 2020 | 5.01 | 2.29 | – | 105 | – | – | – | – |
| Zhong et al. | 2020 | 5.43(1) | 2.11 | – | 7480 | 0.000 | – | – | – |
| Cantat-Gaudin & Anders | 2020 | 5.43 | – | – | – | – | – | – | – |
| Cantat-Gaudin et al. | 2018 | 5.43 | – | – | – | – | – | – | – |
| Loktin & Popova | 2017 | 5.62 | 1.25 | – | 631 | – | – | – | – |
| Dias et al. | 2016 | 2.78 | 2.11 | – | 30 | – | – | – | – |
| Kharchenko et al. | 2016 | 2.75 | 1.97 | – | 20 | – | – | – | – |
| Kharchenko et al. | 2013 | 2.75 | 1.97 | – | 20 | – | – | – | – |
(N): Indicates that there are N extra values assigned to this parameter in the corresponding reference.
Almeida et al. (2025)
Mass determination: worst fit. Isochrone match: intermediate fit.
Cavallo et al. (2024)
Gold sample.
Hunt & Reffert (2024)
Classified as open cluster. CMD class: 0.99 (50th percentile).
Hunt & Reffert (2023)
Classified as open cluster. CMD class: 0.99 (50th percentile).
Hu et al. (2021)
Ellipticities (core, all): e_core=0.5464, e_all=0.0595.
Bica et al. (2019)
The Preliminary Amateur Open Cluster Catalog, Version 08/03/2003.