Stock 7
(MWSC 202; FoF 2320)
0.80
UTI
0.77
CN
1.0
Cdens
1.0
CC3
1.0
Clit
0.84
Cdup
Stellar density (N50/rad)
20.7 [N/pc2]
- CN 0.77 Rich
- Cdens 1.0 Very dense
- CC3 1.0 Very high quality
- Clit 1.0 Very well-studied
- Cdup 0.84 Very likely unique
 MOCA
MOCA
Overview
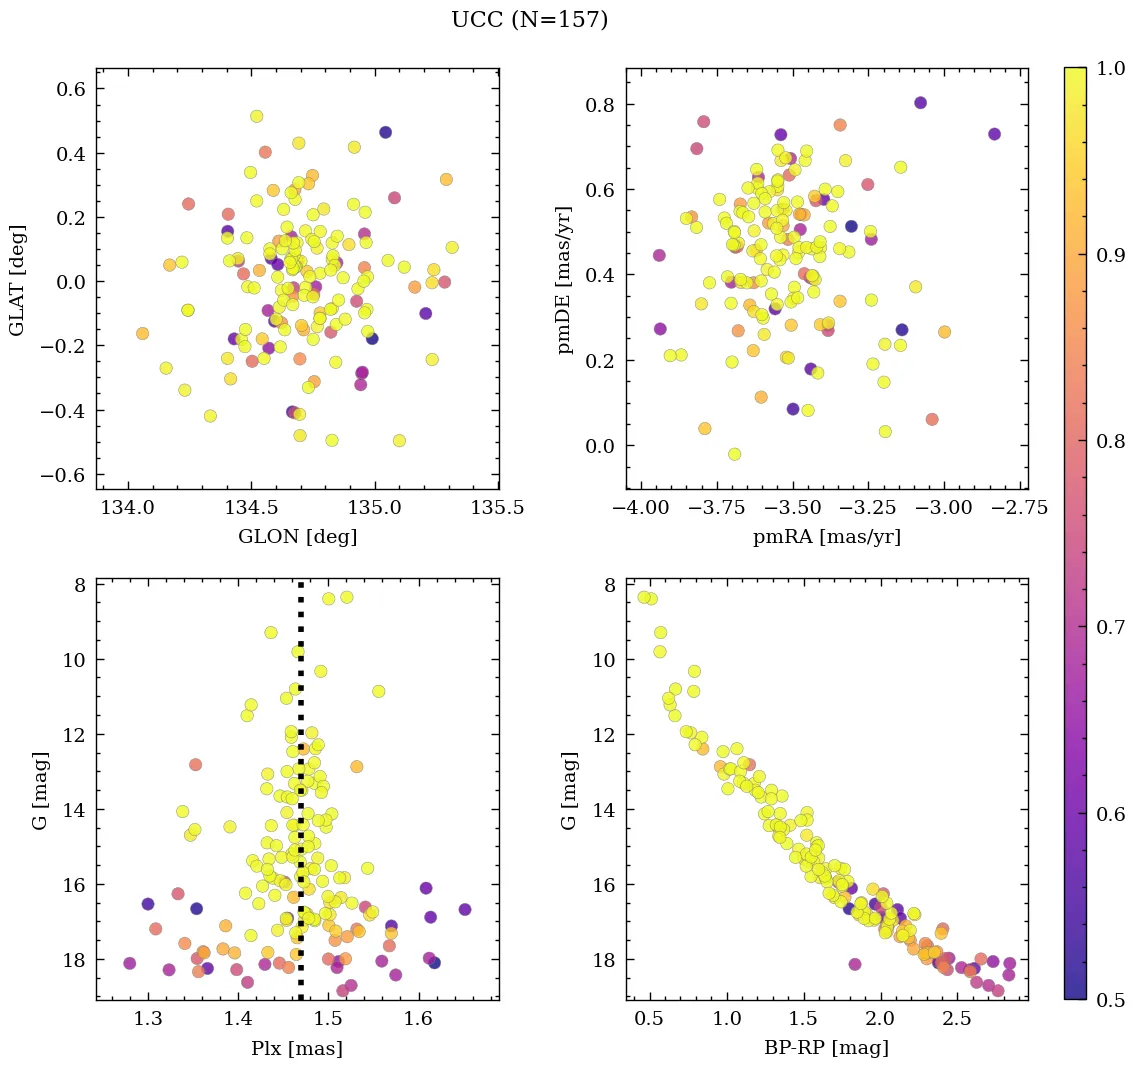
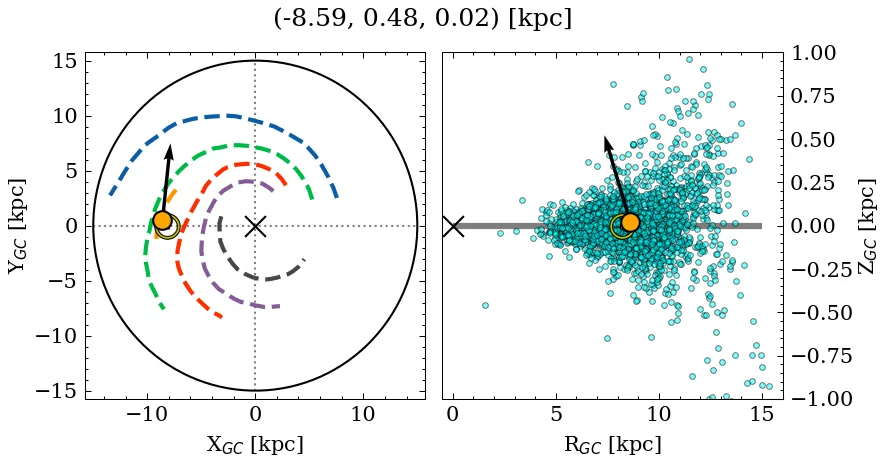
Stock 7 is a rich, very dense object of very high C3 quality. Its parallax locates it at a close distance, near the mid-plane, affected by moderate extinction. It is catalogued as a near-solar metallicity, young cluster, but with a large variance across recent sources for the age, metallicity, and mass parameters (see Parameters). It is very well-studied in the literature.
Note: This is very likely a unique object, which shares a small percentage of members with at least one previously reported entry. See table with shared members information.
Data
| Reference | Year | RA [deg] | DEC [deg] | Plx [mas] | pmRA [mas/yr] | pmDE [mas/yr] | Rv [km/s] |
|---|---|---|---|---|---|---|---|
| UCC | 99999– | 37.438 | 60.606 | 1.469 | -3.533 | 0.464 | -7.816 |
| Li et al. | 2025 | 37.431 | 60.627 | 1.441 | -3.496 | 0.484 | – |
| Almeida et al. | 2025 | 37.419 | 60.624 | – | – | – | – |
| Alfonso et al. | 2024 | 37.404 | 60.622 | 1.436 | -3.538 | 0.448 | – |
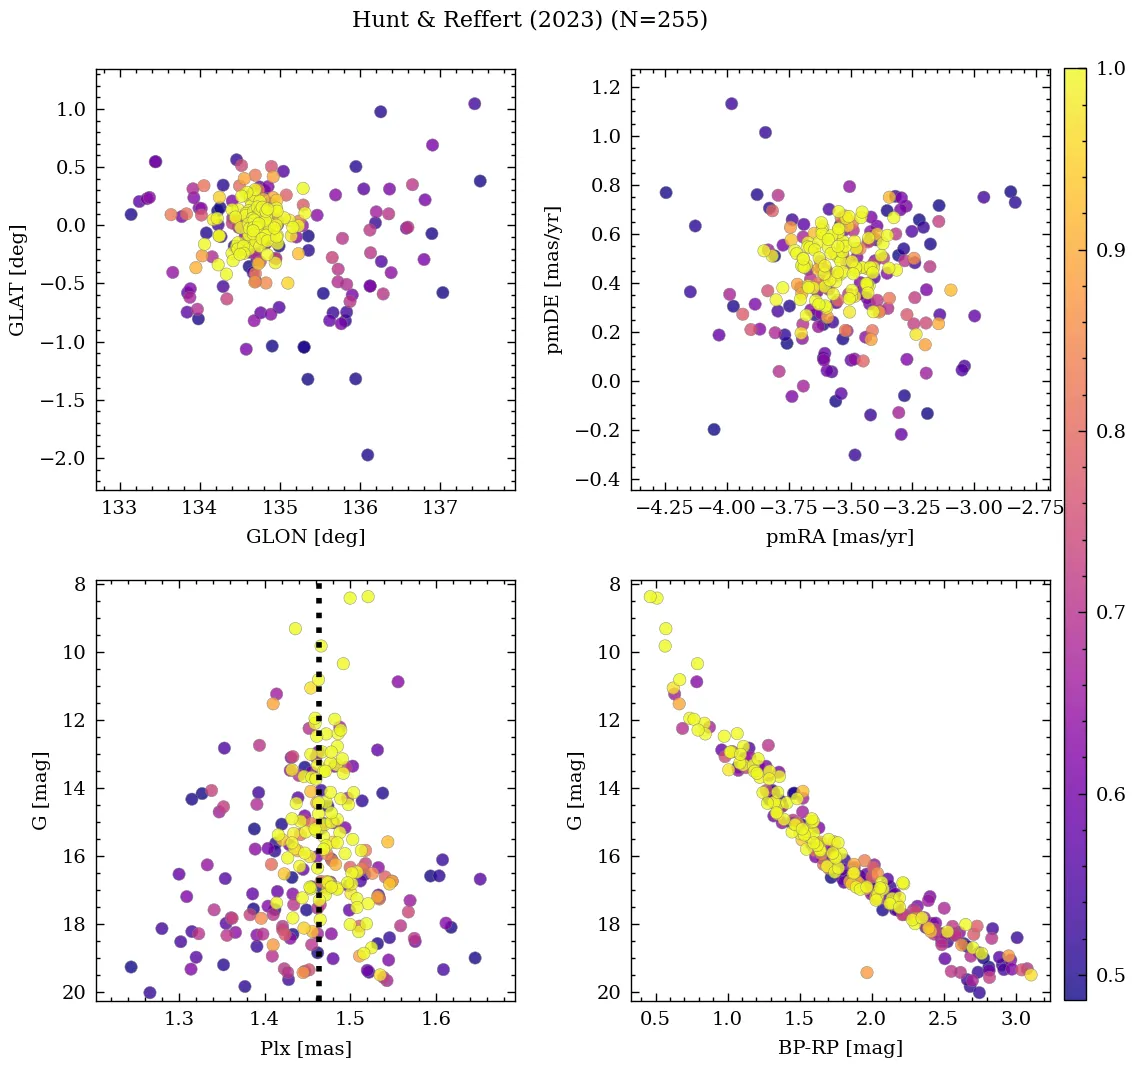
| Hunt & Reffert | 2024 | 37.424 | 60.655 | 1.461 | -3.533 | 0.429 | -8.369 |
| Cavallo et al. | 2024 | 37.579 | 60.521 | 1.465 | – | – | – |
| Hunt & Reffert | 2023 | 37.424 | 60.655 | 1.461 | -3.533 | 0.429 | -8.369 |
| Almeida et al. | 2023 | 37.449 | 60.642 | – | – | – | – |
| Just et al. | 2023 | 37.42 | 60.672 | – | – | – | – |
| He et al. | 2022 | 37.429 | 60.641 | 1.471 | -3.549 | 0.47 | – |
| Tarricq et al. | 2022 | 37.453 | 60.594 | 1.466 | -3.597 | 0.473 | – |
| Jaehnig et al. | 2021 | 37.445 | 60.67 | 1.477 | -3.523 | 0.585 | – |
| Rain et al. | 2021 | 37.431 | 60.627 | 1.441 | -3.496 | 0.484 | – |
| Dias et al. | 2021 | 37.419 | 60.624 | 1.439 | -3.482 | 0.511 | 4.769 |
| Spina et al. | 2021 | 37.438 | 60.629 | 1.438 | -3.51 | 0.544 | – |
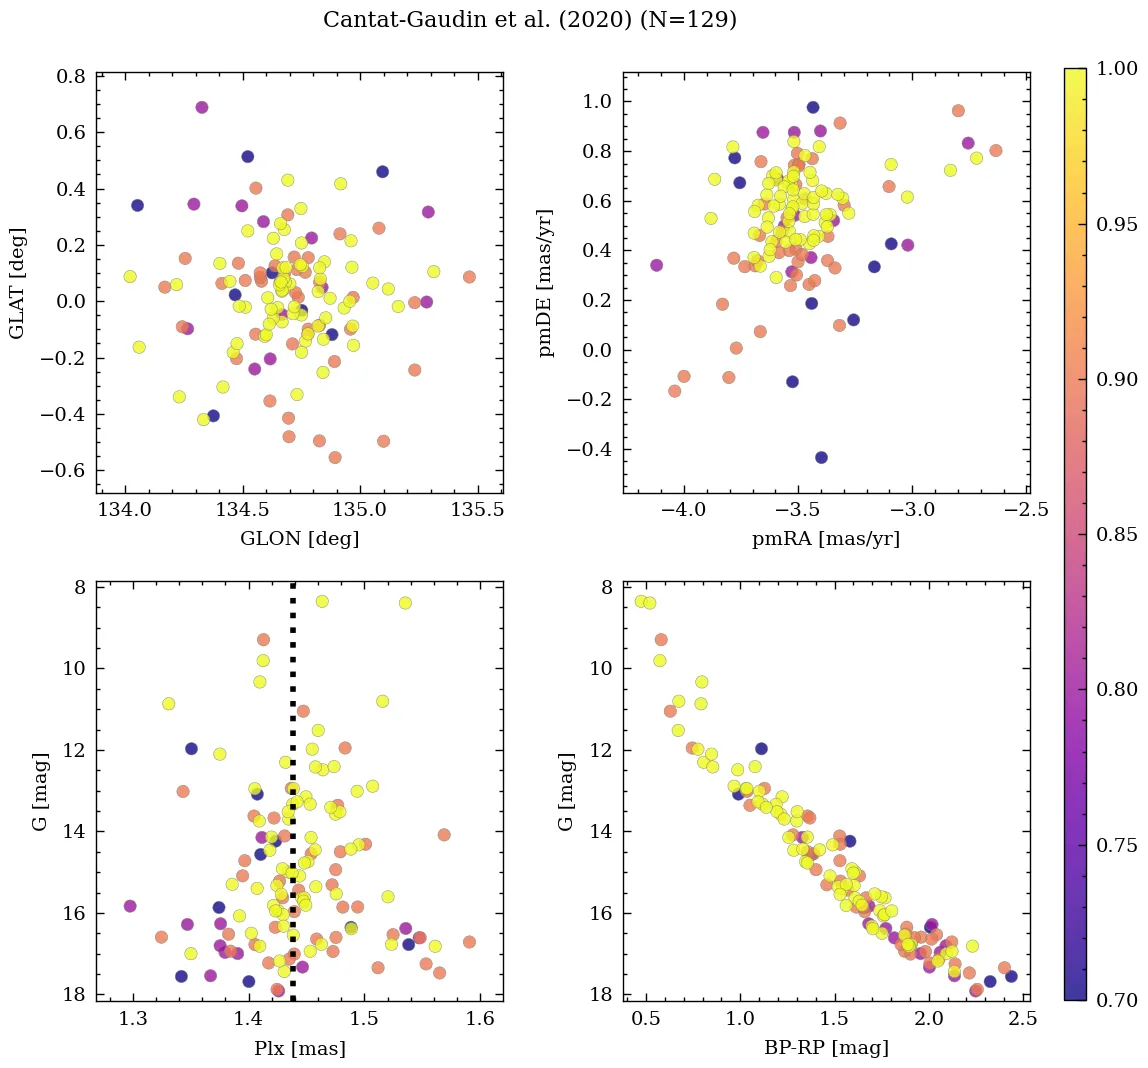
| Cantat-Gaudin et al. | 2020 | 37.431 | 60.627 | 1.441 | -3.496 | 0.484 | – |
| Zhong et al. | 2020 | 37.431 | 60.627 | – | -3.496 | 0.484 | -21.963 |
| Cantat-Gaudin & Anders | 2020 | 37.431 | 60.627 | 1.441 | -3.496 | 0.484 | – |
| Liu & Pang | 2019 | 37.463 | 60.609 | 1.441 | -3.464 | 0.517 | – |
| Soubiran et al. | 2018 | 37.431 | 60.627 | – | – | – | 4.79 |
| Cantat-Gaudin et al. | 2018 | 37.431 | 60.627 | 1.441 | -3.496 | 0.484 | – |
| Kharchenko et al. | 2016 | 37.42 | 60.672 | – | – | – | – |
| Kharchenko et al. | 2013 | 37.432 | 60.675 | – | -2.38 | -1.33 | -3.7 |
| Kharchenko et al. | 2012 | 37.432 | 60.675 | – | -2.38 | -1.33 | -3.67 |
| Piskunov et al. | 2008 | 37.406 | 60.706 | – | – | – | – |
| Kharchenko et al. | 2007 | 37.41 | 60.71 | – | 0.18 | – | -3.67 |
| van den Bergh | 2006 | 37.4 | 60.717 | – | – | – | – |
| Kharchenko et al. | 2005 | 37.41 | 60.71 | – | -4.89 | -0.62 | -0.5 |
| Chen et al. | 2003 | 37.225 | 60.645 | – | -3.33 | 0.24 | -8.0 |
💡 Note: The UCC values are estimated from its identified members.
| Reference | Year | Dist [kpc] | Av [mag] | DAv [mag] | Age [Myr] | [Fe/H] [dex] | Mass [Msun] | Bfrac | BSS |
|---|---|---|---|---|---|---|---|---|---|
| UCC | 99999– | 0.69 | 1.65 | 1.62 | 63 | 0.054 | 310 | 0.64 | 0.0 |
| Li et al. | 2025 | 0.60 | 1.41 | – | 330 | 0.054 | – | – | – |
| Almeida et al. | 2025 | 0.67 | 1.62 | – | 100 | – | 361 | – | – |
| Alfonso et al. | 2024 | 0.71 | 1.46 | – | 72 | 0.327 | – | – | – |
| Hunt & Reffert | 2024 | – | – | – | – | – | 422(1) | – | – |
| Cavallo et al. | 2024 | 0.71 | 1.95 | – | 36 | -0.030 | – | – | – |
| Hunt & Reffert | 2023 | 0.64 | 1.69 | 1.62 | 56 | – | – | – | – |
| Almeida et al. | 2023 | 0.66 | 1.74 | – | 150 | 0.067 | 260(1) | 0.64 | – |
| Just et al. | 2023 | – | – | – | 63 | – | 17 | – | – |
| He et al. | 2022 | – | 1.90 | – | 50 | – | – | – | – |
| Tarricq et al. | 2022 | 0.69 | – | – | 78 | – | – | – | – |
| Jaehnig et al. | 2021 | 0.68(1) | – | – | – | – | – | – | – |
| Rain et al. | 2021 | 0.68 | 1.86 | – | 16 | – | – | – | 0 |
| Dias et al. | 2021 | 0.67 | 1.62 | – | 100 | 0.327 | – | – | – |
| Spina et al. | 2021 | 0.70 | – | – | 72 | – | – | – | – |
| Cantat-Gaudin et al. | 2020 | 0.71 | 1.46 | – | 72 | – | – | – | – |
| Zhong et al. | 2020 | 0.85 | 1.65 | – | 7800 | 0.000 | – | – | – |
| Cantat-Gaudin & Anders | 2020 | 0.68 | – | – | – | – | – | – | – |
| Liu & Pang | 2019 | – | – | – | 43 | 0.000 | – | – | – |
| Soubiran et al. | 2018 | 0.68 | – | – | – | – | – | – | – |
| Cantat-Gaudin et al. | 2018 | 0.68 | – | – | – | – | – | – | – |
| Kharchenko et al. | 2016 | 0.85 | 1.65 | – | 63 | – | – | – | – |
| Kharchenko et al. | 2013 | 0.85 | 1.65 | – | 63 | – | – | – | – |
| Kharchenko et al. | 2012 | 0.85 | 1.65 | – | 63 | – | – | – | – |
| Piskunov et al. | 2008 | 0.70 | 1.74 | – | 13 | – | – | – | – |
| van den Bergh | 2006 | 0.70 | 1.89 | – | 16 | – | – | – | – |
| Kharchenko et al. | 2005 | 0.70 | 1.74 | – | 13 | – | – | – | – |
| Chen et al. | 2003 | 0.45 | – | – | 10 | – | – | – | – |
(N): Indicates that there are N extra values assigned to this parameter in the corresponding reference.
Cavallo et al. (2024)
Gold sample.
Almeida et al. (2025)
Mass determination: good fit. Isochrone match: good fit. Silver sample.