Stock 5
(MWSC 163; FoF 2344)
0.91
UTI
0.78
CN
1.0
Cdens
0.75
CC3
1.0
Clit
1.0
Cdup
Stellar density (N50/rad)
37.8 [N/pc2]
- CN 0.78 Rich
- Cdens 1.0 Very dense
- CC3 0.75 High quality
- Clit 1.0 Very well-studied
- Cdup 1.0 Unique
 MOCA
MOCA
Overview
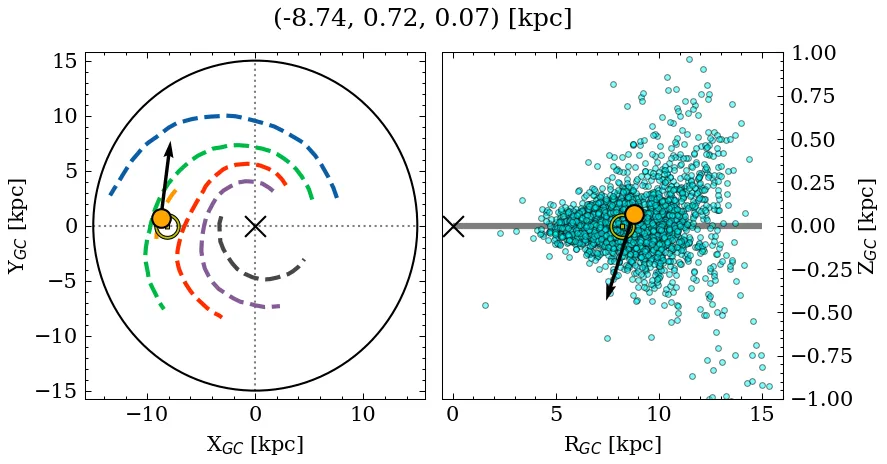
Stock 5 is a rich, very dense object of high C3 quality. Its parallax locates it at a close distance, above the mid-plane, affected by moderate extinction. It is catalogued as a near-solar metallicity, young cluster, but with a large variance across recent sources for the absorption, age, and metallicity parameters (see Parameters). It is very well-studied in the literature.
Note: This object shares a very small percentage of members with a later reported entry. See table with shared members information.
Data
| Reference | Year | RA [deg] | DEC [deg] | Plx [mas] | pmRA [mas/yr] | pmDE [mas/yr] | Rv [km/s] |
|---|---|---|---|---|---|---|---|
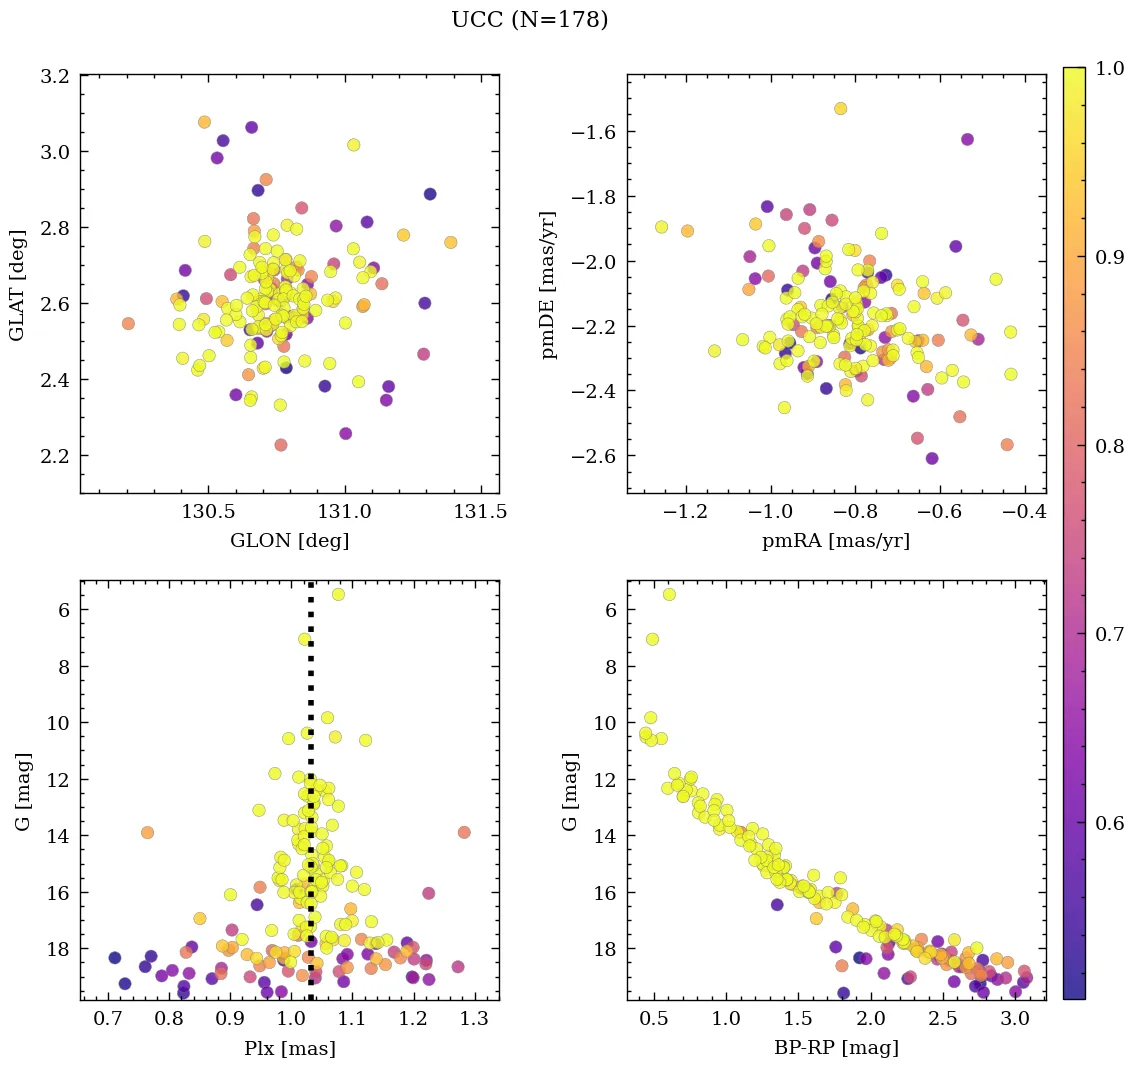
| UCC | 99999– | 31.157 | 64.363 | 1.032 | -0.811 | -2.2 | -24.663 |
| Li et al. | 2025 | 31.119 | 64.365 | 1.013 | -0.729 | -2.069 | – |
| Almeida et al. | 2025 | 31.131 | 64.374 | – | – | – | – |
| Alfonso et al. | 2024 | 31.132 | 64.352 | 1.007 | -0.822 | -2.179 | – |
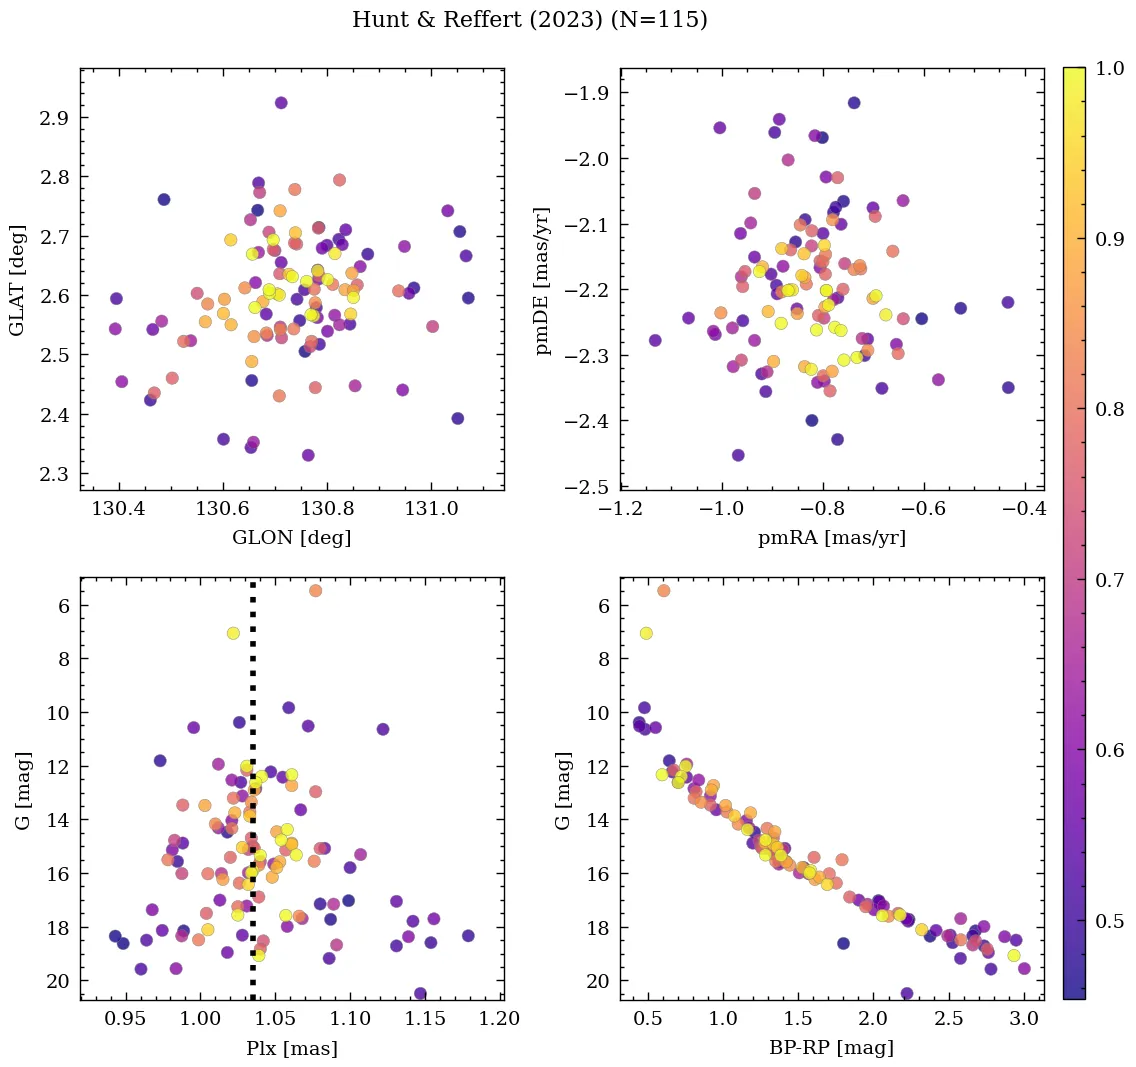
| Hunt & Reffert | 2024 | 31.179 | 64.365 | 1.041 | -0.827 | -2.204 | -29.633 |
| Cavallo et al. | 2024 | 31.094 | 64.357 | 1.041 | – | – | – |
| Hunt & Reffert | 2023 | 31.179 | 64.365 | 1.041 | -0.827 | -2.204 | -29.633 |
| Almeida et al. | 2023 | 31.158 | 64.368 | – | – | – | – |
| Just et al. | 2023 | 31.123 | 64.352 | – | – | – | – |
| He et al. | 2022 | 31.08 | 64.372 | 1.036 | -0.821 | -2.201 | – |
| Richer et al. | 2021 | 31.127 | 64.369 | 1.024 | -0.726 | -2.027 | – |
| Dias et al. | 2021 | 31.131 | 64.374 | 1.016 | -0.738 | -2.071 | – |
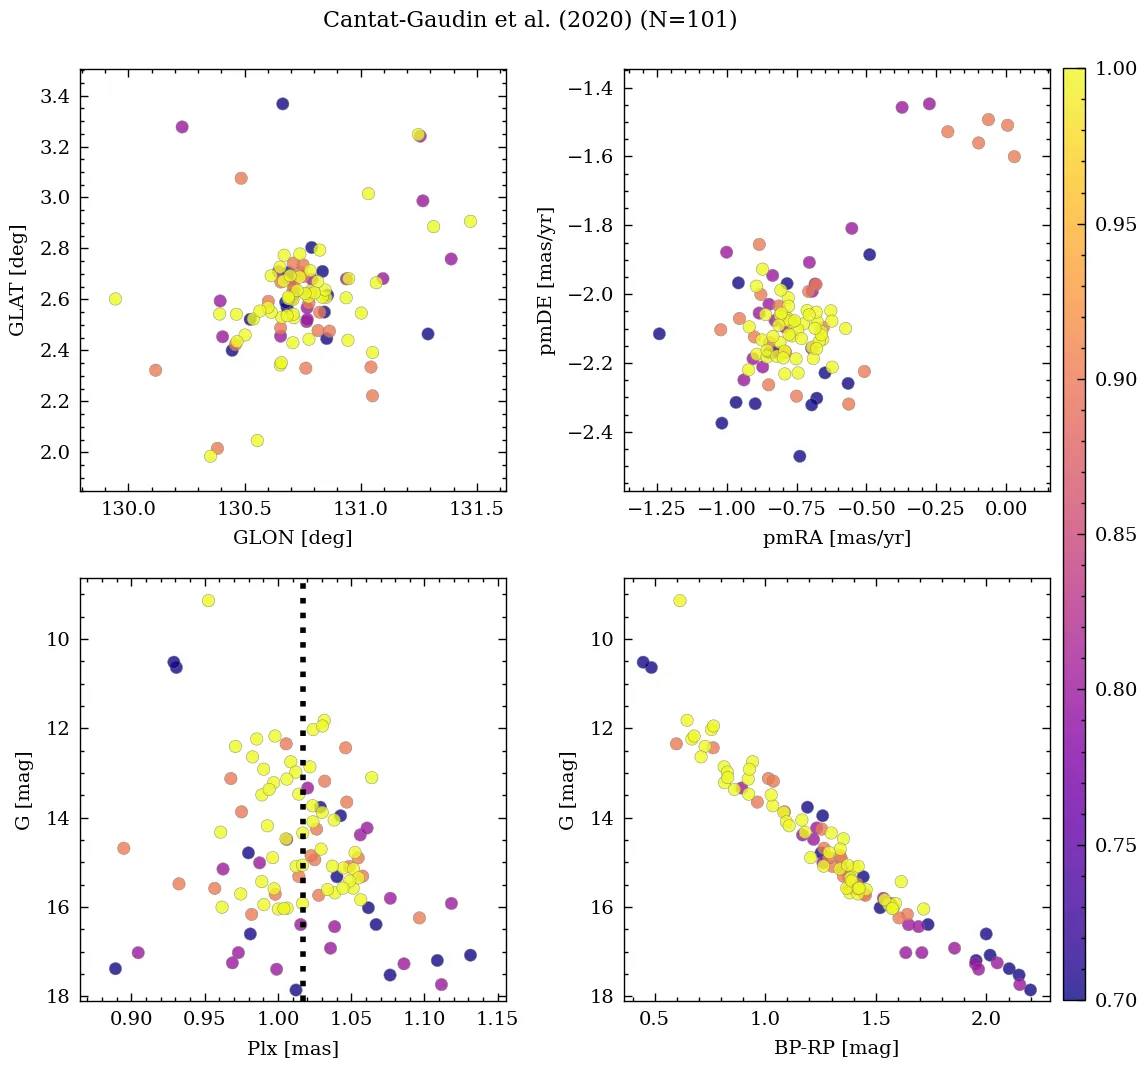
| Cantat-Gaudin et al. | 2020 | 31.119 | 64.365 | 1.013 | -0.729 | -2.069 | – |
| Cantat-Gaudin & Anders | 2020 | 31.119 | 64.365 | 1.013 | -0.729 | -2.069 | – |
| Liu & Pang | 2019 | 31.06 | 64.352 | 1.011 | -0.721 | -2.11 | – |
| Soubiran et al. | 2018 | 31.119 | 64.365 | – | – | – | -33.35 |
| Cantat-Gaudin et al. | 2018 | 31.119 | 64.365 | 1.013 | -0.729 | -2.069 | – |
| Loktin & Popova | 2017 | 31.125 | 64.434 | – | -0.13 | -1.53 | -19.3 |
| Kharchenko et al. | 2016 | 31.123 | 64.352 | – | – | – | – |
| Dias et al. | 2014 | 31.125 | 64.433 | – | -0.13 | -1.53 | – |
| Kharchenko et al. | 2013 | 31.135 | 64.355 | – | 1.12 | -1.16 | -19.3 |
| Gozha et al. | 2012 | 31.125 | 64.433 | – | – | – | – |
| Kharchenko et al. | 2012 | 31.135 | 64.355 | – | 1.07 | -1.26 | -19.3 |
| Piskunov et al. | 2008 | 31.114 | 64.361 | – | – | – | – |
| Kharchenko et al. | 2007 | 31.12 | 64.43 | – | 0.23 | – | -19.7 |
| Kharchenko et al. | 2005 | 31.12 | 64.36 | – | -0.85 | -1.51 | -19.3 |
| Kharchenko et al. | 2003 | 31.17 | 64.35 | – | -0.33 | -2.19 | – |
💡 Note: The UCC values are estimated from its identified members.
| Reference | Year | Dist [kpc] | Av [mag] | DAv [mag] | Age [Myr] | [Fe/H] [dex] | Mass [Msun] | Bfrac | BSS |
|---|---|---|---|---|---|---|---|---|---|
| UCC | 99999– | 0.96 | 1.49 | 0.67 | 54 | 0.124 | 260 | 0.75 | – |
| Liu et al. | 2025 | 1.53 | 0.51 | – | 30 | – | – | – | – |
| Li et al. | 2025 | 0.85 | 1.46 | – | 34 | 0.051 | – | – | – |
| Almeida et al. | 2025 | 0.94 | 1.72 | – | 134 | – | 260 | – | – |
| Alfonso et al. | 2024 | 0.98 | 1.21 | – | 213 | 0.126 | – | – | – |
| Hunt & Reffert | 2024 | – | – | – | – | – | 273(1) | – | – |
| Cavallo et al. | 2024 | 1.14 | 1.55 | – | 33 | 0.660 | – | – | – |
| Hunt & Reffert | 2023 | 0.92 | 1.40 | 0.67 | 36 | – | – | – | – |
| Almeida et al. | 2023 | 0.92 | 1.68 | – | 117 | 0.122 | 446(1) | 0.75 | – |
| Just et al. | 2023 | – | – | – | 50 | – | 105 | – | – |
| He et al. | 2022 | – | 1.85 | – | 25 | – | – | – | – |
| Tarricq et al. | 2022 | 0.95 | – | – | 138 | – | – | – | – |
| Richer et al. | 2021 | – | 1.65 | – | 150 | – | – | – | – |
| Dias et al. | 2021 | 0.94 | 1.72 | – | 134 | 0.126 | – | – | – |
| Cantat-Gaudin et al. | 2020 | 0.98 | 1.21 | – | 132 | – | – | – | – |
| Cantat-Gaudin & Anders | 2020 | 0.96 | – | – | – | – | – | – | – |
| Liu & Pang | 2019 | – | – | – | 30 | -1.500 | – | – | – |
| Soubiran et al. | 2018 | 0.96 | – | – | – | – | – | – | – |
| Cantat-Gaudin et al. | 2018 | 0.96 | – | – | – | – | – | – | – |
| Loktin & Popova | 2017 | 0.67 | 1.24 | – | 54 | – | – | – | – |
| Kharchenko et al. | 2016 | 1.10 | 1.52 | – | 50 | – | – | – | – |
| Kharchenko et al. | 2013 | 1.10 | 1.52 | – | 50 | – | – | – | – |
| Gozha et al. | 2012 | 0.53 | – | – | 54 | – | 257 | – | – |
| Kharchenko et al. | 2012 | 1.10 | 1.52 | – | 50 | – | – | – | – |
| Piskunov et al. | 2008 | 1.10 | 1.24 | – | 54 | – | – | – | – |
| Kharchenko et al. | 2005 | 1.10 | 1.24 | – | 54 | – | – | – | – |
| Kharchenko et al. | 2003 | 0.53 | 0.62 | – | – | – | – | – | – |
(N): Indicates that there are N extra values assigned to this parameter in the corresponding reference.
Richer et al. (2021)
The expected number of WDs is 6.3, 0 WD candidates found, and 0 WD candidates found in the wide search.
Liu et al. (2025)
Classified as tidal capture (resonant trapping binary) 181 along with HSC_1071.
Palma et al. (2025)
Part of multiple system G102, along with COIN-Gaia_34, CWNU_466, FSR_0551 and HSC_1071.
Cavallo et al. (2024)
Gold sample.
Almeida et al. (2025)
Mass determination: intermediate fit. Isochrone match: good fit. Silver sample.