Stock 23
0.90
UTI
0.75
CN
1.0
Cdens
0.75
CC3
1.0
Clit
1.0
Cdup
Stellar density (N50/rad)
6.9 [N/pc2]
- CN 0.75 Rich
- Cdens 1.0 Very dense
- CC3 0.75 High quality
- Clit 1.0 Very well-studied
- Cdup 1.0 Unique
 MOCA
MOCA
Overview
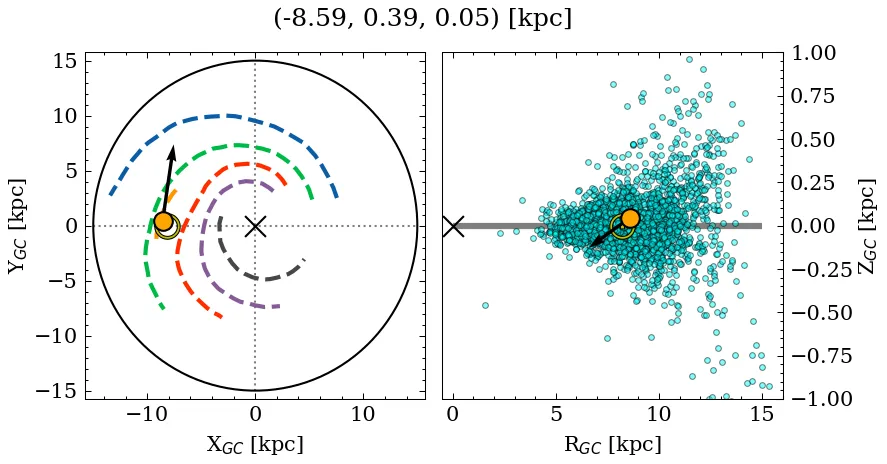
Stock 23 is a rich, very dense object of high C3 quality. Its parallax locates it at a close distance, near the mid-plane, affected by low extinction. It is catalogued as a near-solar metallicity, young cluster, but with a large variance across recent sources for the age and metallicity parameters (see Parameters). It is very well-studied in the literature.
Note: This object shares a small percentage of members with a later reported entry. See table with shared members information.
Data
| Reference | Year | RA [deg] | DEC [deg] | Plx [mas] | pmRA [mas/yr] | pmDE [mas/yr] | Rv [km/s] |
|---|---|---|---|---|---|---|---|
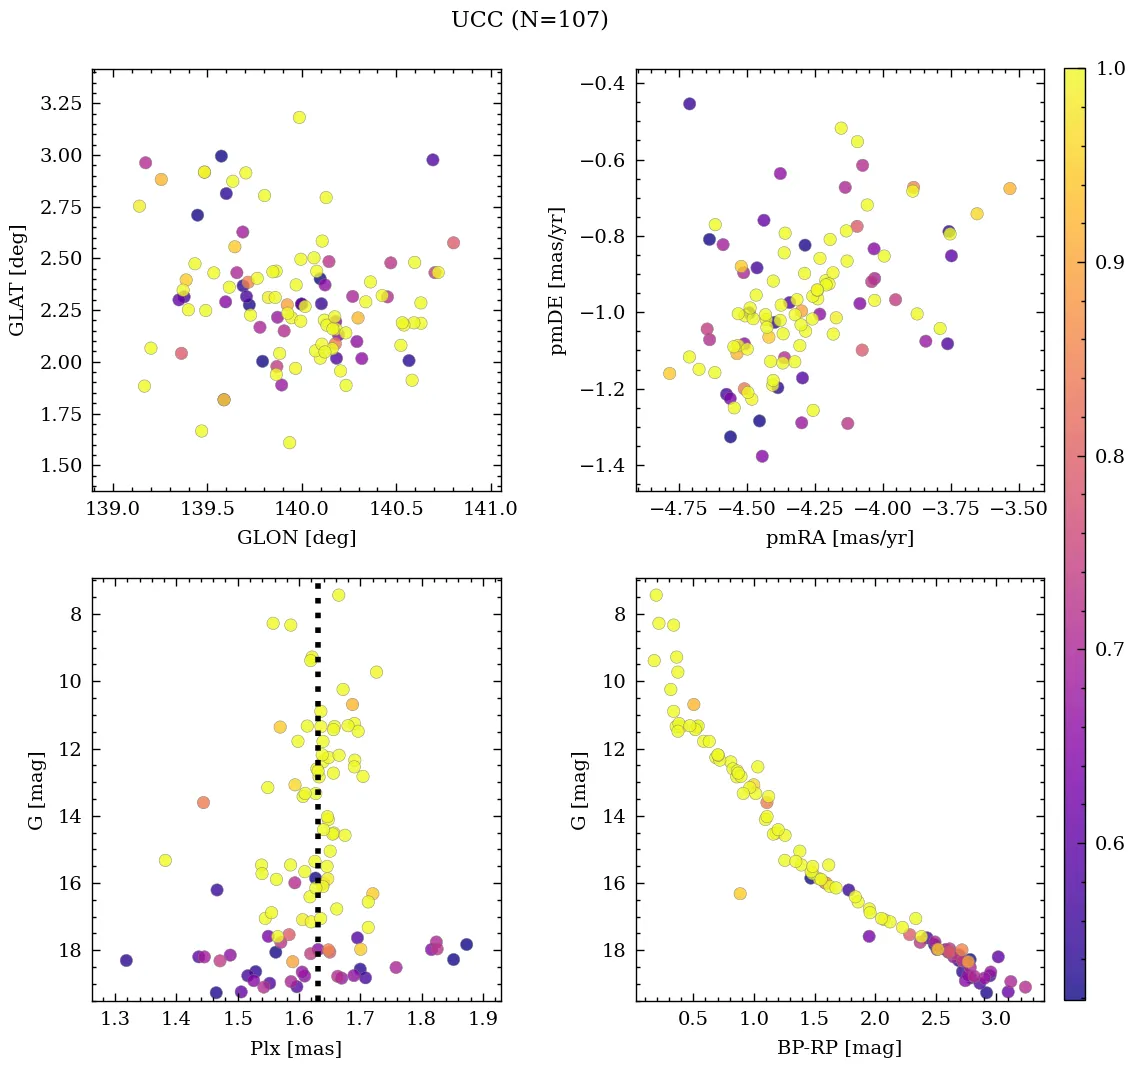
| UCC | 99999– | 49.072 | 60.257 | 1.631 | -4.323 | -1.004 | -21.918 |
| Liu et al. | 2025 | 49.18 | 60.07 | 1.63 | -4.32 | -0.99 | -34.77 |
| Li et al. | 2025 | 49.075 | 60.377 | 1.613 | -4.261 | -0.865 | – |
| Almeida et al. | 2025 | 49.004 | 60.467 | – | – | – | – |
| Alfonso et al. | 2024 | 49.076 | 60.347 | 1.601 | -4.36 | -1.008 | – |
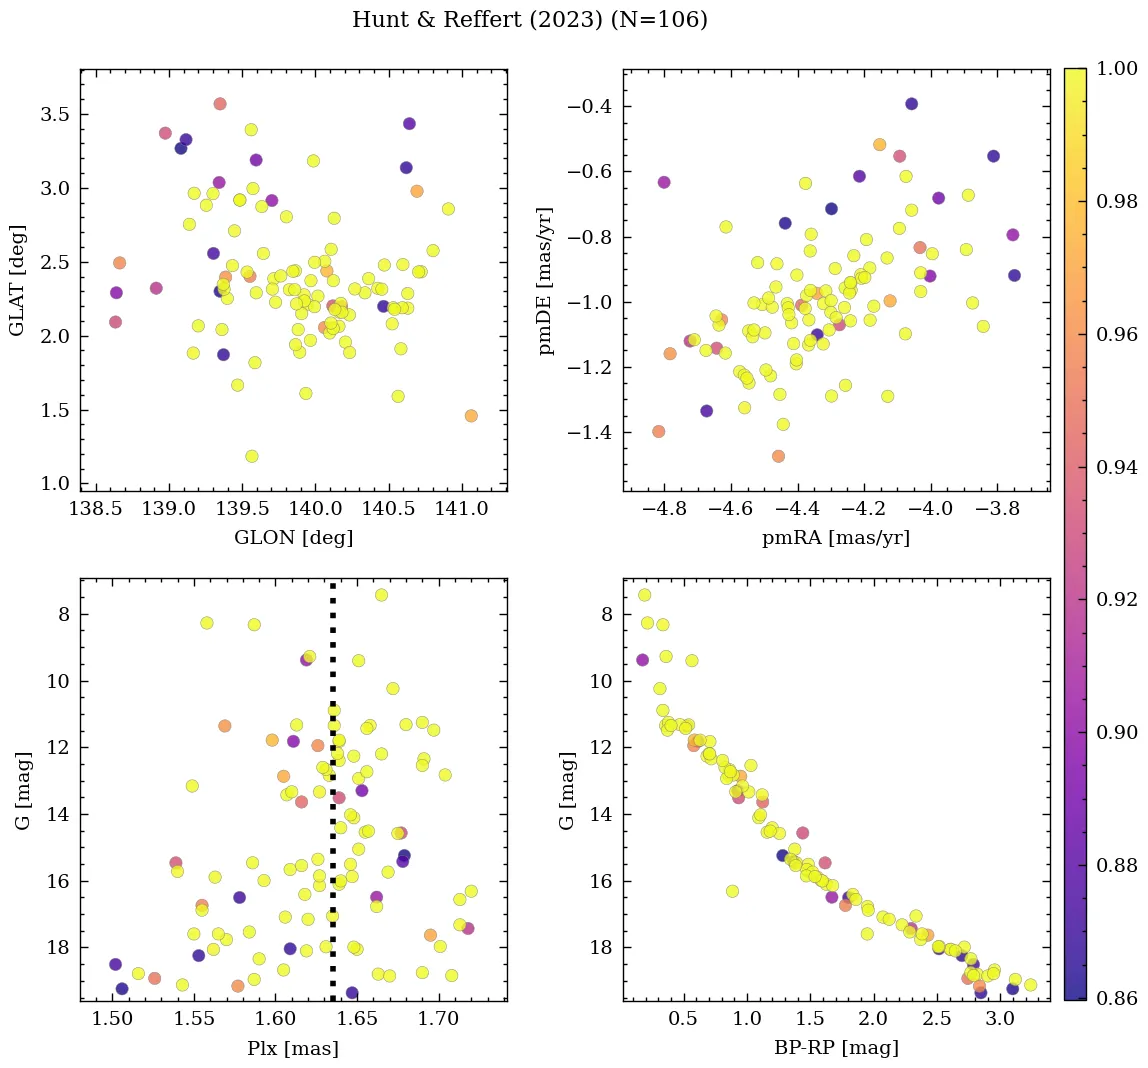
| Hunt & Reffert | 2024 | 49.184 | 60.071 | 1.627 | -4.324 | -0.993 | -34.774 |
| Cavallo et al. | 2024 | 49.036 | 60.371 | 1.635 | – | – | – |
| Hunt & Reffert | 2023 | 49.184 | 60.071 | 1.627 | -4.324 | -0.993 | -34.774 |
| Almeida et al. | 2023 | 49.073 | 60.51 | – | – | – | – |
| He et al. | 2022 | 49.222 | 60.142 | 1.637 | -4.31 | -1.005 | – |
| Tarricq et al. | 2022 | 49.142 | 60.114 | 1.641 | -4.36 | -1.008 | – |
| Richer et al. | 2021 | 49.252 | 60.176 | 1.605 | -4.258 | -0.917 | – |
| Dias et al. | 2021 | 49.004 | 60.467 | 1.609 | -4.25 | -0.874 | -17.241 |
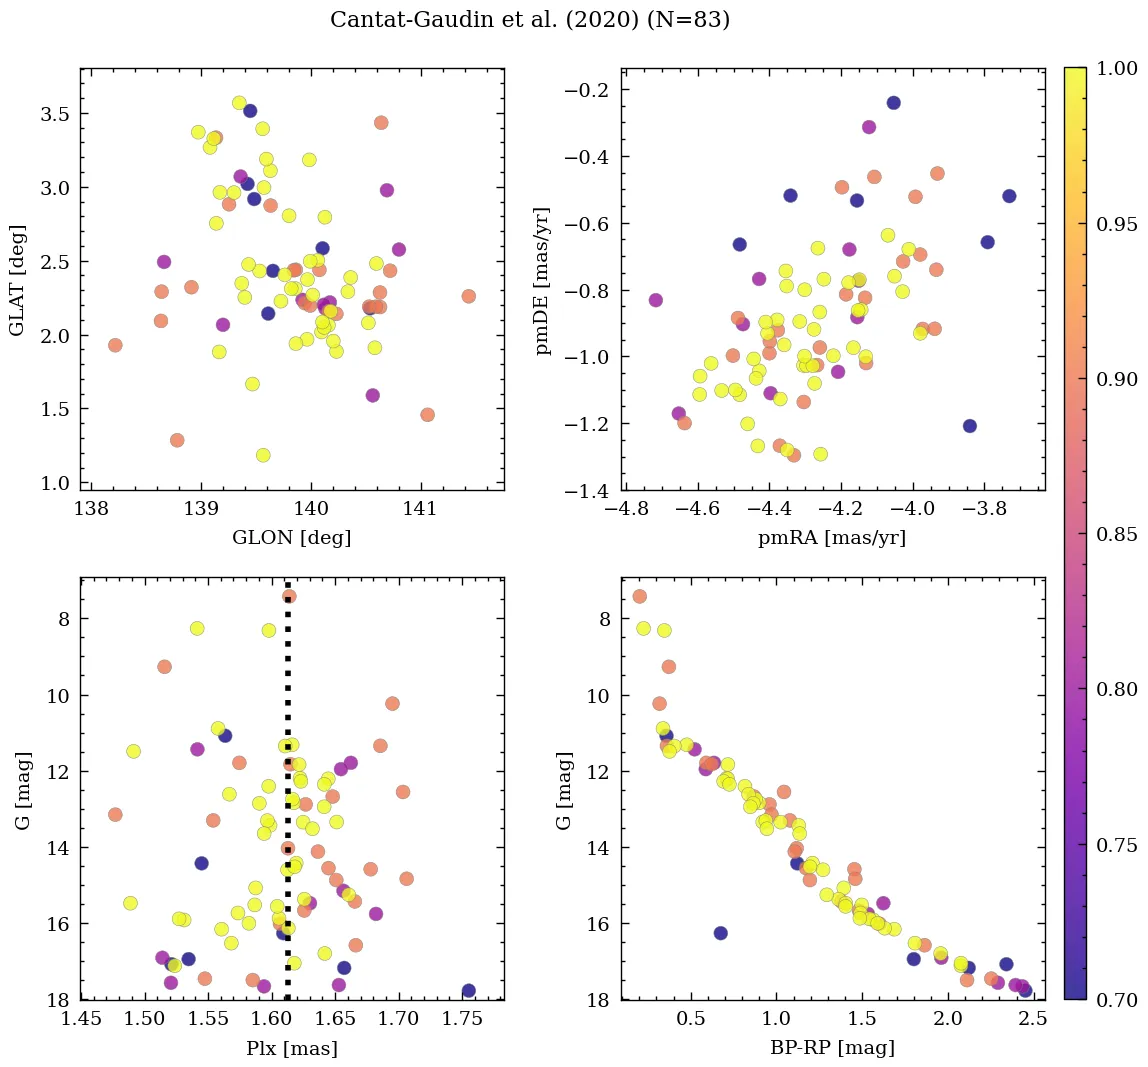
| Cantat-Gaudin et al. | 2020 | 49.075 | 60.377 | 1.613 | -4.261 | -0.865 | – |
| Cantat-Gaudin & Anders | 2020 | 49.075 | 60.377 | 1.613 | -4.261 | -0.865 | – |
| Dias et al. | 2019 | 49.046 | 60.116 | 1.62 | -4.286 | -0.921 | -16.298 |
| Bossini et al. | 2019 | 49.075 | 60.377 | – | – | – | – |
| Soubiran et al. | 2018 | 49.075 | 60.377 | – | – | – | -18.07 |
| Cantat-Gaudin et al. | 2018 | 49.075 | 60.377 | 1.613 | -4.261 | -0.865 | – |
| Loktin & Popova | 2017 | 49.05 | 60.117 | – | 0.41 | -1.33 | -16.8 |
| Dias et al. | 2014 | 49.046 | 60.116 | – | 0.41 | -1.33 | – |
| Gozha et al. | 2012 | 49.046 | 60.116 | – | – | – | – |
| Piskunov et al. | 2008 | 49.033 | 60.053 | – | – | – | – |
| Kharchenko et al. | 2007 | 49.05 | 60.12 | – | 0.18 | – | -16.75 |
| Kharchenko et al. | 2005 | 49.05 | 60.05 | – | -1.34 | -1.11 | -16.75 |
| Kharchenko et al. | 2003 | 49.08 | 60.03 | – | 0.24 | -1.97 | – |
| Dias et al. | 2002 | 49.046 | 60.116 | – | 0.41 | -1.33 | -8.53 |
💡 Note: The UCC values are estimated from its identified members.
| Reference | Year | Dist [kpc] | Av [mag] | DAv [mag] | Age [Myr] | [Fe/H] [dex] | Mass [Msun] | Bfrac | BSS |
|---|---|---|---|---|---|---|---|---|---|
| UCC | 99999– | 0.61 | 0.81 | 1.27 | 72 | 0.054 | 153 | 0.78 | – |
| Liu et al. | 2025 | 0.90 | 0.34 | – | 55 | – | – | – | – |
| Li et al. | 2025 | 0.56 | 0.67 | – | 82 | -0.048 | – | – | – |
| Almeida et al. | 2025 | 0.60 | 0.82 | – | 231 | – | 182 | – | – |
| Alfonso et al. | 2024 | 0.63 | 0.61 | – | 214 | 0.054 | – | – | – |
| Hunt & Reffert | 2024 | – | – | – | – | – | 124(1) | – | – |
| Cavallo et al. | 2024 | 0.64 | 1.07 | – | 44 | 0.330 | – | – | – |
| Hunt & Reffert | 2023 | 0.58 | 0.69 | 1.27 | 72 | – | – | – | – |
| Almeida et al. | 2023 | 0.60 | 0.97 | – | 142 | -0.053 | 301(1) | 0.78 | – |
| He et al. | 2022 | – | 1.10 | – | 50 | – | – | – | – |
| Tarricq et al. | 2022 | 0.61 | – | – | 112 | – | – | – | – |
| Richer et al. | 2021 | – | 0.95 | – | 90 | – | – | – | – |
| Dias et al. | 2021 | 0.60 | 0.82 | – | 231 | 0.054 | – | – | – |
| Cantat-Gaudin et al. | 2020 | 0.63 | 0.61 | – | 110 | – | – | – | – |
| Cantat-Gaudin & Anders | 2020 | 0.61 | – | – | – | – | – | – | – |
| Dias et al. | 2019 | 0.73 | 1.02 | – | 44 | 0.680 | – | – | – |
| Bossini et al. | 2019 | 0.60 | 0.75 | – | 94 | 0.000 | – | – | – |
| Soubiran et al. | 2018 | 0.61 | – | – | – | – | – | – | – |
| Cantat-Gaudin et al. | 2018 | 0.61 | – | – | – | – | – | – | – |
| Loktin & Popova | 2017 | 0.73 | 0.81 | – | 32 | – | – | – | – |
| Gozha et al. | 2012 | 1.00 | – | – | 32 | – | 7 | – | – |
| Piskunov et al. | 2008 | 0.38 | 0.81 | – | 32 | – | – | – | – |
| Kharchenko et al. | 2005 | 0.38 | 0.81 | – | 32 | – | – | – | – |
| Kharchenko et al. | 2003 | 1.00 | 0.93 | – | – | – | – | – | – |
| Dias et al. | 2002 | 0.38 | 0.81 | – | 32 | – | – | – | – |
(N): Indicates that there are N extra values assigned to this parameter in the corresponding reference.
Richer et al. (2021)
The expected number of WDs is 1.75, 0 WD candidates found, and 0 WD candidates found in the wide search.
Liu et al. (2025)
Classified as primordial binary cluster 340 along with Theia_85, and of multiple system 51 along with Theia_85 and HSC_1149.
Cavallo et al. (2024)
Gold sample.
Almeida et al. (2025)
Mass determination: intermediate fit. Isochrone match: good fit.