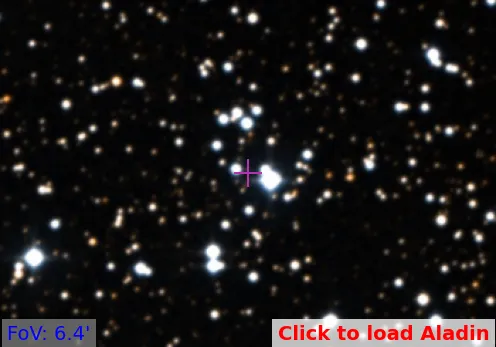
Stock 20
(MWSC 39)
0.95
UTI
0.74
CN
1.0
Cdens
1.0
CC3
1.0
Clit
1.0
Cdup
Stellar density (N50/rad)
12.7 [N/pc2]
- CN 0.74 Moderately populated
- Cdens 1.0 Very dense
- CC3 1.0 Very high quality
- Clit 1.0 Very well-studied
- Cdup 1.0 Unique
 MOCA
MOCA
Overview
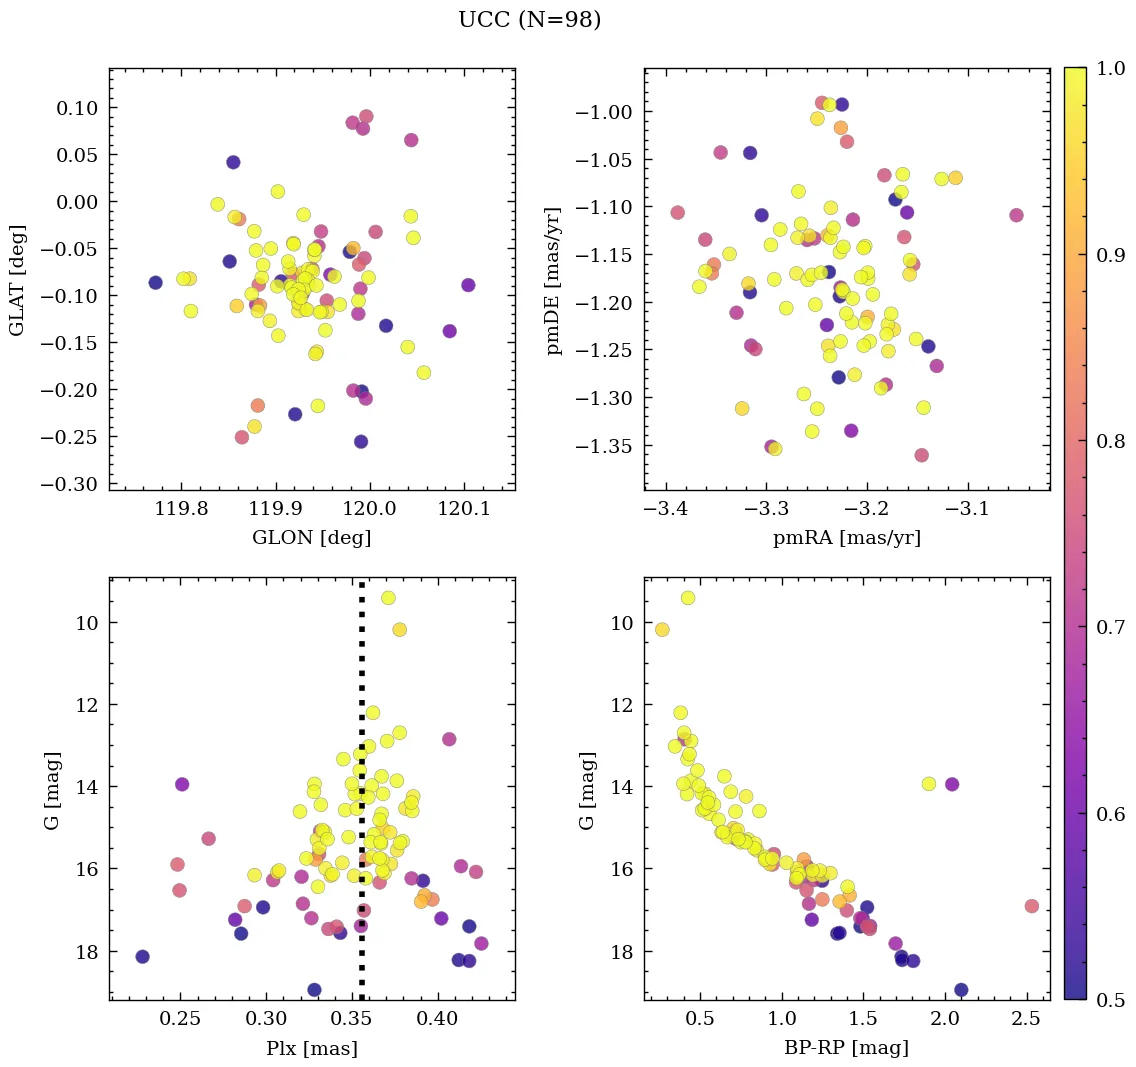
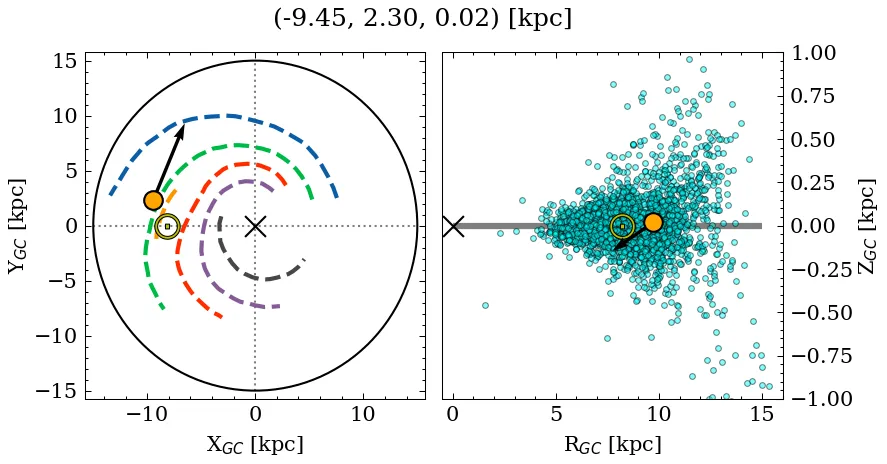
Stock 20 is a moderately populated, very dense object of very high C3 quality. Its parallax locates it at a moderate* distance, near the mid-plane, affected by low extinction. It is catalogued as a near-solar metallicity, young cluster, but with a large variance across recent sources for the age, metallicity, and mass parameters (see Parameters). It is very well-studied in the literature.
(*): The parallax distance estimate (~2.81 kpc) differs significantly from the median photometric distance (~2.16 kpc).
Data
| Reference | Year | RA [deg] | DEC [deg] | Plx [mas] | pmRA [mas/yr] | pmDE [mas/yr] | Rv [km/s] |
|---|---|---|---|---|---|---|---|
| UCC | 99999– | 6.322 | 62.627 | 0.356 | -3.227 | -1.173 | -71.883 |
| Liu et al. | 2025 | 6.31 | 62.63 | 0.35 | -3.19 | -1.16 | -53.8 |
| Li et al. | 2025 | 6.318 | 62.624 | 0.342 | -3.237 | -1.124 | – |
| Almeida et al. | 2025 | 6.309 | 62.615 | – | – | – | – |
| Hunt & Reffert | 2024 | 6.311 | 62.626 | 0.353 | -3.194 | -1.157 | -53.804 |
| Celli et al. | 2024 | 6.318 | 62.624 | – | – | – | – |
| Cavallo et al. | 2024 | 6.446 | 62.704 | 0.354 | – | – | – |
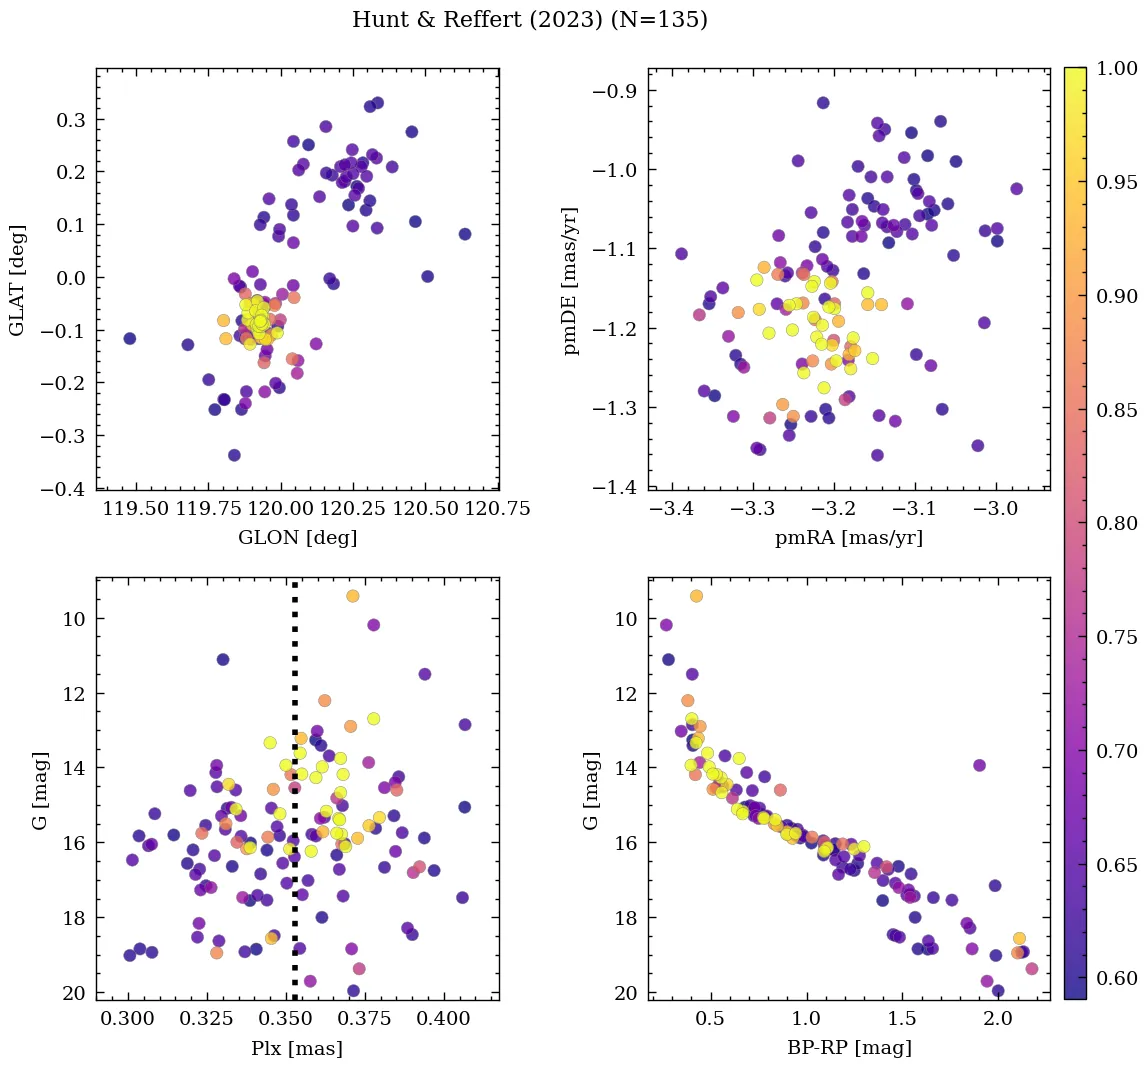
| Hunt & Reffert | 2023 | 6.311 | 62.626 | 0.353 | -3.194 | -1.157 | -53.804 |
| Almeida et al. | 2023 | 6.296 | 62.617 | – | – | – | – |
| Just et al. | 2023 | 6.304 | 62.598 | – | – | – | – |
| Dias et al. | 2021 | 6.309 | 62.615 | 0.345 | -3.235 | -1.129 | – |
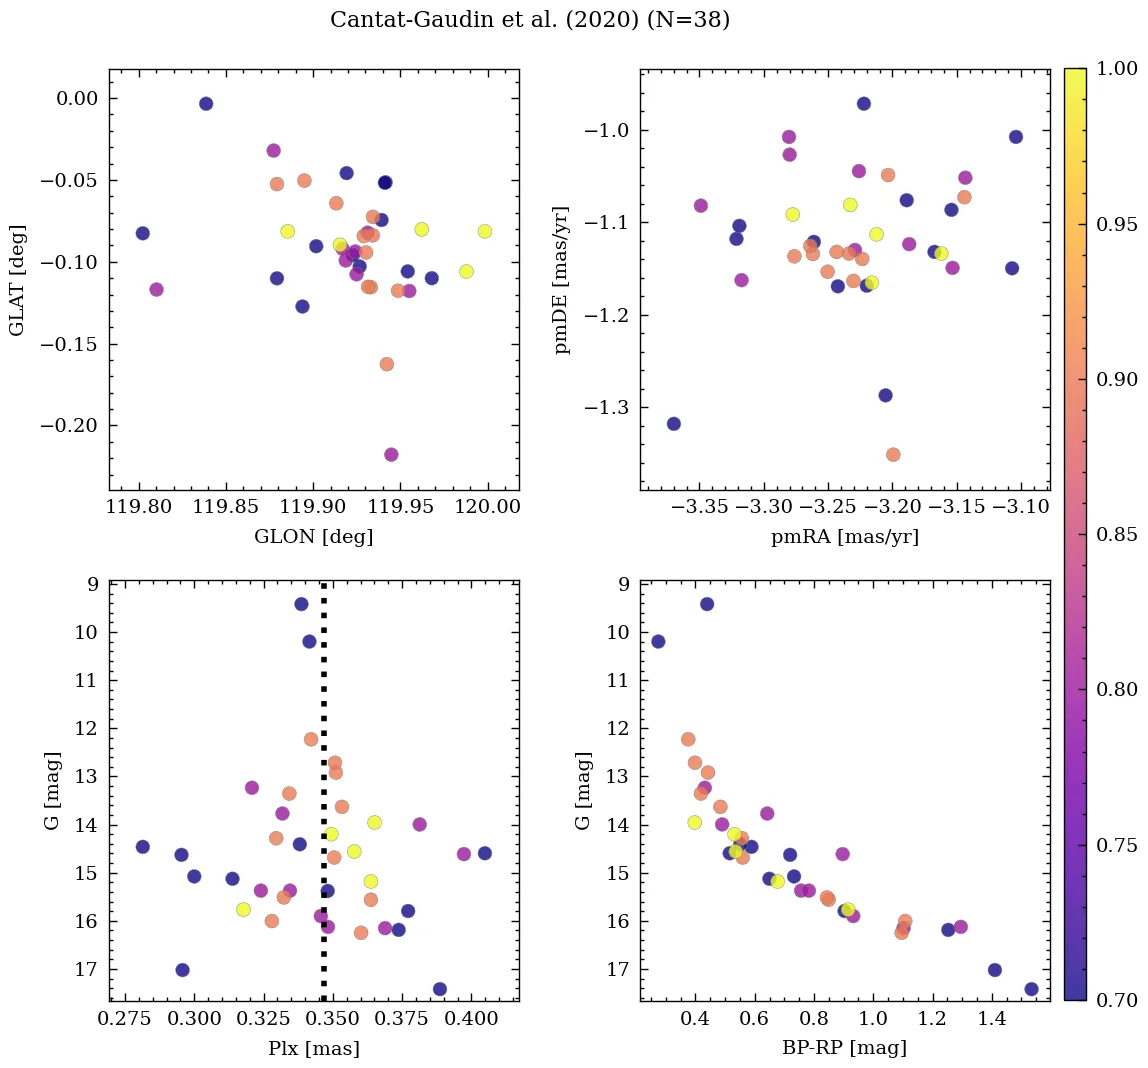
| Cantat-Gaudin et al. | 2020 | 6.318 | 62.624 | 0.342 | -3.237 | -1.124 | – |
| Sánchez et al. | 2020 | 6.312 | 62.617 | – | -3.319 | -1.235 | – |
| Cantat-Gaudin & Anders | 2020 | 6.318 | 62.624 | 0.342 | -3.237 | -1.124 | – |
| Cantat-Gaudin et al. | 2018 | 6.318 | 62.624 | 0.342 | -3.237 | -1.124 | – |
| Loktin & Popova | 2017 | 6.315 | 62.617 | – | -2.66 | -3.132 | – |
| Kharchenko et al. | 2016 | 6.304 | 62.598 | – | – | – | – |
| Dias et al. | 2014 | 6.312 | 62.617 | – | -2.53 | 2.51 | – |
| Kharchenko et al. | 2013 | 6.313 | 62.602 | – | -2.56 | -3.24 | – |
| Kharchenko et al. | 2012 | 6.313 | 62.602 | – | -2.56 | -3.24 | – |
| Bukowiecki et al. | 2011 | 6.321 | 62.621 | – | – | – | – |
| Piskunov et al. | 2008 | 6.299 | 62.618 | – | – | – | – |
| Kharchenko et al. | 2005 | 6.31 | 62.62 | – | -0.4 | -1.12 | – |
| Kharchenko et al. | 2003 | 6.31 | 62.61 | – | 0.55 | -1.18 | – |
| Dias et al. | 2002 | 6.312 | 62.617 | – | -2.53 | 2.51 | – |
💡 Note: The UCC values are estimated from its identified members.
| Reference | Year | Dist [kpc] | Av [mag] | DAv [mag] | Age [Myr] | [Fe/H] [dex] | Mass [Msun] | Bfrac | BSS |
|---|---|---|---|---|---|---|---|---|---|
| UCC | 99999– | 2.16 | 0.68 | 1.48 | 62 | -0.150 | 326 | 0.64 | – |
| Liu et al. | 2025 | 4.23 | 0.47 | – | 17 | – | – | – | – |
| Li et al. | 2025 | 2.16 | 1.40 | – | 13 | -0.342 | – | – | – |
| Almeida et al. | 2025 | 2.57 | 1.48 | – | 13 | – | 354 | – | – |
| Hunt & Reffert | 2024 | – | – | – | – | – | 484(1) | – | – |
| Celli et al. | 2024 | – | – | – | 19 | – | 254 | – | – |
| Cavallo et al. | 2024 | 2.39 | 1.39 | – | 17 | -0.200 | – | – | – |
| Hunt & Reffert | 2023 | 2.64 | 1.12 | 1.48 | 24 | – | – | – | – |
| Almeida et al. | 2023 | 2.41 | 1.48 | – | 18 | -0.033 | 298(1) | 0.64 | – |
| Just et al. | 2023 | – | – | – | 217 | – | 42 | – | – |
| Dias et al. | 2021 | 2.57 | 1.48 | – | 13 | -0.100 | – | – | – |
| Cantat-Gaudin et al. | 2020 | 2.59 | 1.09 | – | 19 | – | – | – | – |
| Cantat-Gaudin & Anders | 2020 | 2.69 | – | – | – | – | – | – | – |
| Cantat-Gaudin et al. | 2018 | 2.69 | – | – | – | – | – | – | – |
| Loktin & Popova | 2017 | 2.15 | 0.86 | – | 148 | – | – | – | – |
| Kharchenko et al. | 2016 | 1.10 | 0.62 | – | 217 | – | – | – | – |
| Kharchenko et al. | 2013 | 1.10 | 0.62 | – | 217 | – | – | – | – |
| Bukowiecki et al. | 2012 | – | – | – | – | – | 412 | – | – |
| Kharchenko et al. | 2012 | 1.10 | 0.62 | – | 217 | – | – | – | – |
| Bukowiecki et al. | 2011 | 2.02(1) | 0.68 | – | 100 | – | – | – | – |
| Piskunov et al. | 2008 | 0.91 | 0.62 | – | 339 | – | – | – | – |
| Kharchenko et al. | 2005 | 0.91 | 0.62 | – | 339 | – | – | – | – |
| Kharchenko et al. | 2003 | 0.91 | 0.62 | – | – | – | – | – | – |
| Dias et al. | 2002 | 1.10 | 0.62 | – | 217 | – | – | – | – |
(N): Indicates that there are N extra values assigned to this parameter in the corresponding reference.
Liu et al. (2025)
Classified as tidal capture (resonant trapping binary) 143 along with FSR_0498, and of multiple system 37 along with CWNU_1298 and FSR_0498.
Palma et al. (2025)
Part of multiple system G84, along with CWNU_1298 and FSR_0498.
Piecka & Paunzen (2021)
Belongs to cluster aggregate 'Agg56' along with SAI 4.
Cavallo et al. (2024)
Gold sample.
Almeida et al. (2025)
Mass determination: good fit. Isochrone match: good fit.