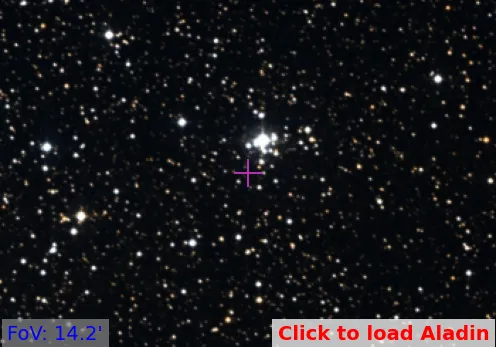
Stock 17
(MWSC 3754)
0.65
UTI
0.48
CN
0.34
Cdens
0.75
CC3
0.84
Clit
1.0
Cdup
Stellar density (N50/rad)
1.7 [N/pc2]
- CN 0.48 Poorly populated
- Cdens 0.34 Loose
- CC3 0.75 High quality
- Clit 0.84 Well-studied
- Cdup 1.0 Unique
 MOCA
MOCA
Overview
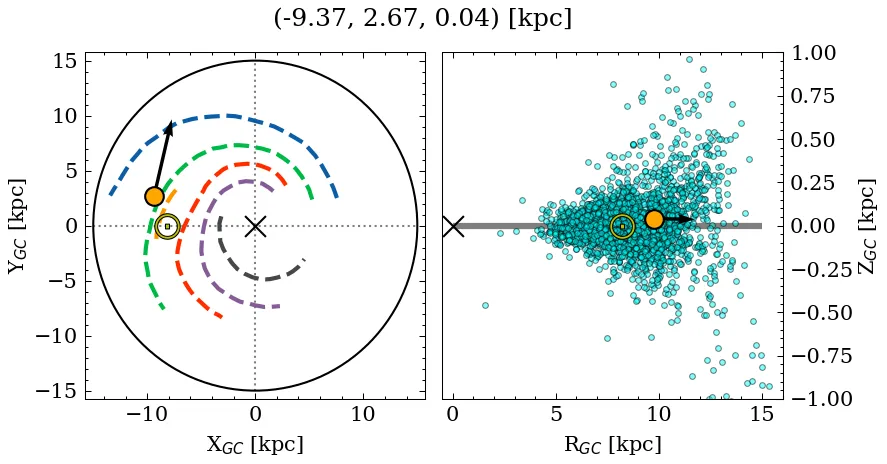
Stock 17 is a poorly populated, loose object of high C3 quality. Its parallax locates it at a moderate* distance, near the mid-plane, affected by moderate extinction. It is catalogued as a near-solar metallicity, very young cluster (see Parameters). It is well-studied in the literature.
(*): The parallax distance estimate (~3.13 kpc) differs significantly from the median photometric distance (~2.40 kpc).
Note: This object shares a moderate percentage of members with a later reported entry. See table with shared members information.
Data
| Reference | Year | RA [deg] | DEC [deg] | Plx [mas] | pmRA [mas/yr] | pmDE [mas/yr] | Rv [km/s] |
|---|---|---|---|---|---|---|---|
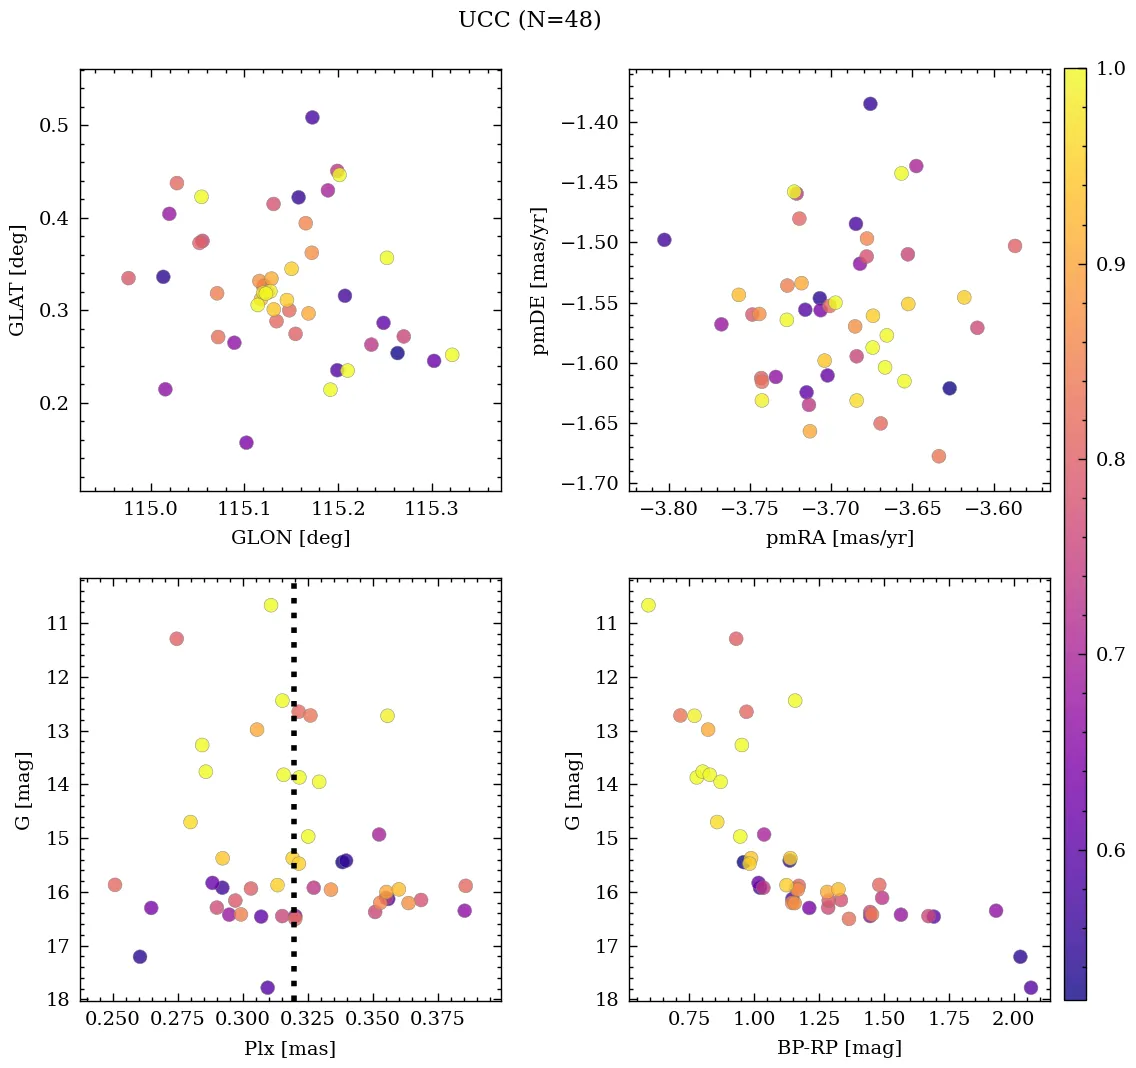
| UCC | 99999– | 355.966 | 62.16 | 0.32 | -3.699 | -1.56 | – |
| Hunt & Reffert | 2024 | 355.954 | 62.16 | 0.317 | -3.639 | -1.579 | – |
| Celli et al. | 2024 | 355.949 | 62.161 | – | – | – | – |
| Cavallo et al. | 2024 | 356.3 | 62.084 | 0.317 | – | – | – |
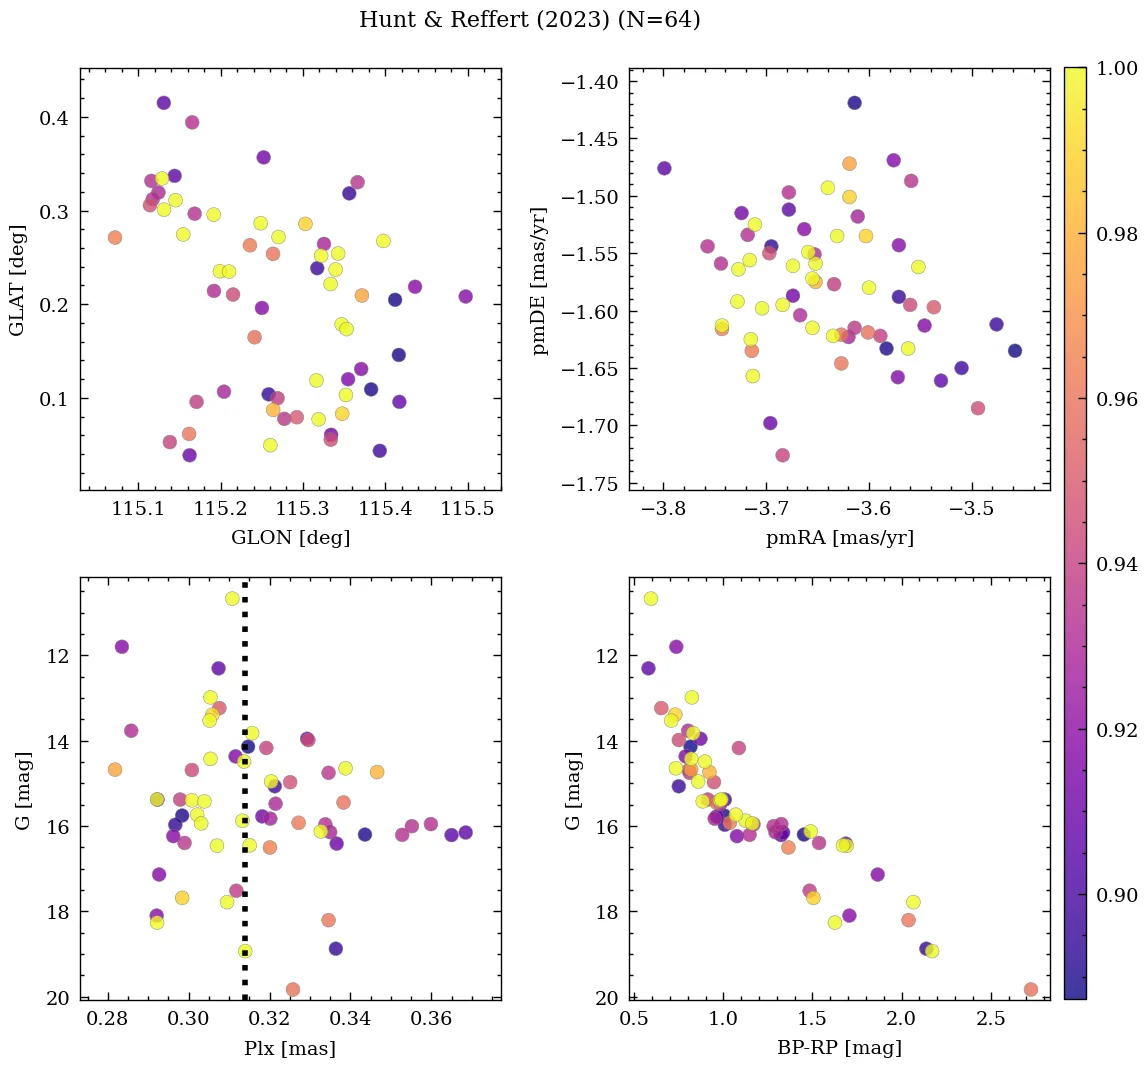
| Hunt & Reffert | 2023 | 355.954 | 62.16 | 0.317 | -3.639 | -1.579 | – |
| Just et al. | 2023 | 355.938 | 62.162 | – | – | – | – |
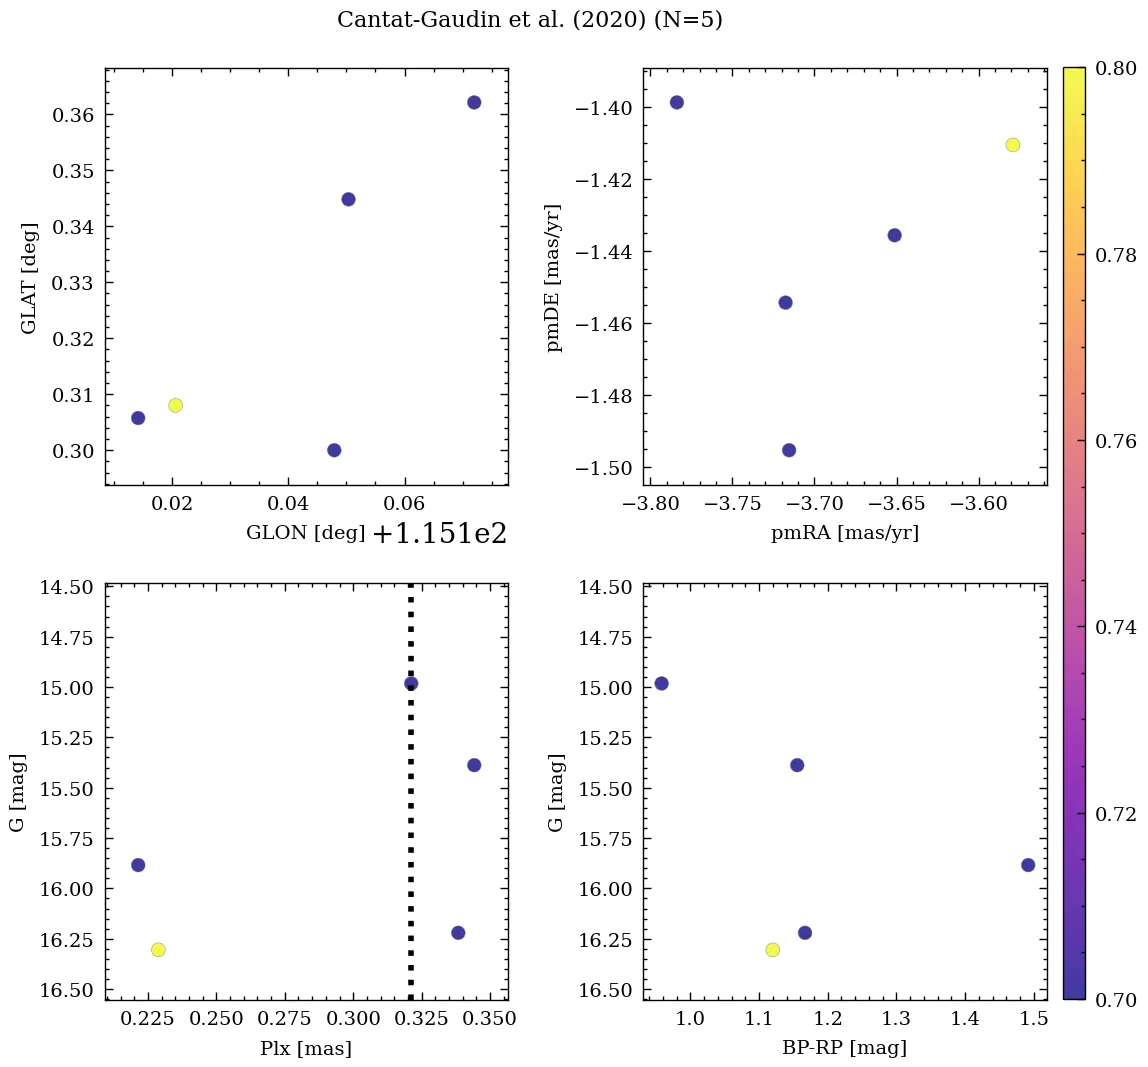
| Cantat-Gaudin et al. | 2020 | 355.949 | 62.161 | 0.309 | -3.691 | -1.525 | – |
| Cantat-Gaudin & Anders | 2020 | 355.949 | 62.161 | 0.309 | -3.691 | -1.525 | – |
| Cantat-Gaudin et al. | 2018 | 355.949 | 62.161 | 0.309 | -3.691 | -1.525 | – |
| Loktin & Popova | 2017 | 355.95 | 62.16 | – | -1.58 | -2.55 | -44.8 |
| Kharchenko et al. | 2016 | 355.938 | 62.162 | – | – | – | – |
| Kharchenko et al. | 2013 | 355.947 | 62.165 | – | -2.05 | -6.88 | -44.8 |
| Kharchenko et al. | 2012 | 355.947 | 62.165 | – | -2.05 | -7.0 | -44.8 |
| Bukowiecki et al. | 2011 | 355.925 | 62.166 | – | – | – | – |
| van den Bergh | 2006 | 356.5 | 62.183 | – | – | – | – |
| Dias et al. | 2002 | 355.946 | 62.16 | – | -1.58 | -2.55 | -44.8 |
| Dambis | 1999 | 356.5 | 62.183 | – | – | – | – |
💡 Note: The UCC values are estimated from its identified members.
| Reference | Year | Dist [kpc] | Av [mag] | DAv [mag] | Age [Myr] | [Fe/H] [dex] | Mass [Msun] | Bfrac | BSS |
|---|---|---|---|---|---|---|---|---|---|
| UCC | 99999– | 2.4 | 2.17 | 0.94 | 10 | 0.290 | 154 | – | – |
| Hunt & Reffert | 2024 | – | – | – | – | – | 250(1) | – | – |
| Celli et al. | 2024 | – | – | – | 10 | – | 80 | – | – |
| Cavallo et al. | 2024 | 2.87 | 2.04 | – | 23 | 0.290 | – | – | – |
| Hunt & Reffert | 2023 | 3.10 | 1.96 | 0.94 | 12 | – | – | – | – |
| Just et al. | 2023 | – | – | – | 10 | – | 107 | – | – |
| Cantat-Gaudin & Anders | 2020 | 2.96 | – | – | – | – | – | – | – |
| Cantat-Gaudin et al. | 2018 | 2.96 | – | – | – | – | – | – | – |
| Loktin & Popova | 2017 | 2.14 | 2.28 | – | 6 | – | – | – | – |
| Kharchenko et al. | 2016 | 2.40 | 2.17 | – | 10 | – | – | – | – |
| Kharchenko et al. | 2013 | 2.40 | 2.17 | – | 10 | – | – | – | – |
| Bukowiecki et al. | 2012 | – | – | – | – | – | 200 | – | – |
| Kharchenko et al. | 2012 | 2.40 | 2.17 | – | 10 | – | – | – | – |
| Bukowiecki et al. | 2011 | 2.54(1) | 1.74 | – | 8 | – | – | – | – |
| van den Bergh | 2006 | 2.14 | 2.29 | – | 6 | – | – | – | – |
| Dias et al. | 2002 | 2.14 | 2.28 | – | 6 | – | – | – | – |
| Dambis | 1999 | 2.23 | 2.38 | – | 5 | – | – | – | – |
(N): Indicates that there are N extra values assigned to this parameter in the corresponding reference.
Cavallo et al. (2024)
Gold sample.