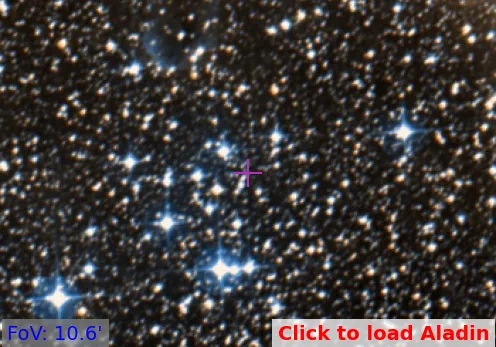
Stock 13
(MWSC 1921)
0.73
UTI
0.64
CN
0.5
Cdens
0.75
CC3
0.87
Clit
1.0
Cdup
Stellar density (N50/rad)
2.5 [N/pc2]
- CN 0.64 Moderately populated
- Cdens 0.5 Moderately dense
- CC3 0.75 High quality
- Clit 0.87 Well-studied
- Cdup 1.0 Unique
 MOCA
MOCA
Overview
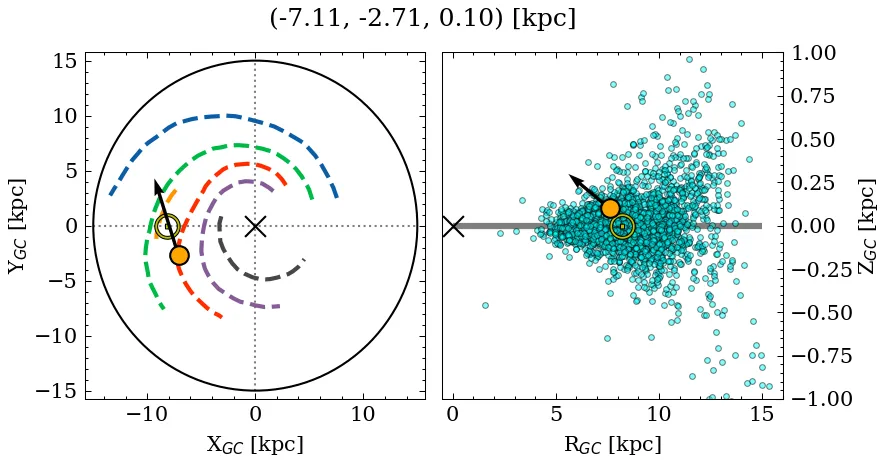
Stock 13 is a moderately populated, moderately dense object of high C3 quality. Its parallax locates it at a moderate* distance, above the mid-plane, affected by low extinction. It is catalogued as a near-solar metallicity, very young cluster, but with a large variance across recent sources for the mass parameter (see Parameters). It is well-studied in the literature.
(*): The parallax distance estimate (~3.07 kpc) differs significantly from the median photometric distance (~1.58 kpc).
Note: This object shares a significant percentage of members with a later reported entry. See table with shared members information.
Data
| Reference | Year | RA [deg] | DEC [deg] | Plx [mas] | pmRA [mas/yr] | pmDE [mas/yr] | Rv [km/s] |
|---|---|---|---|---|---|---|---|
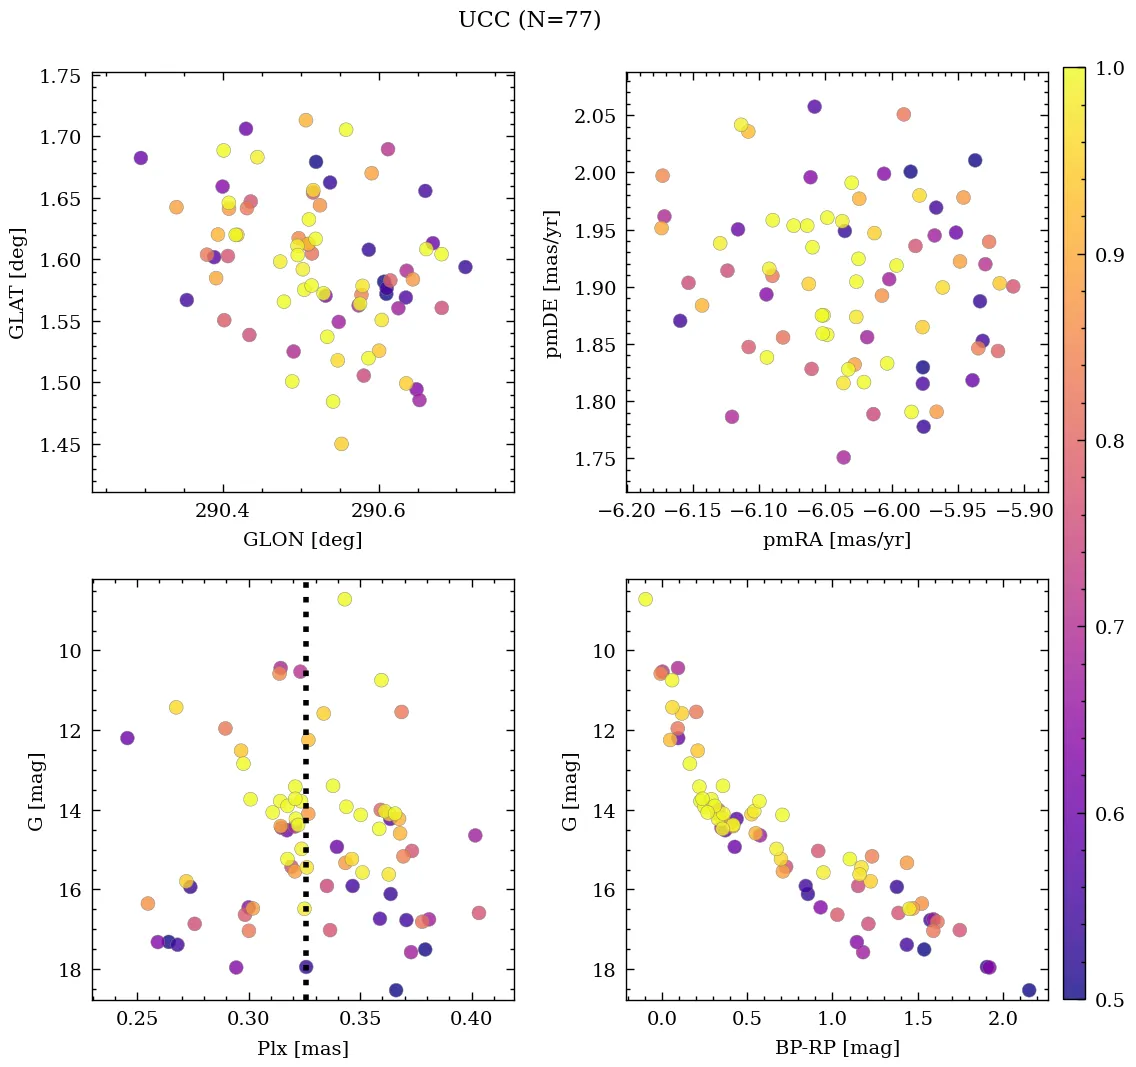
| UCC | 99999– | 168.293 | -58.885 | 0.326 | -6.027 | 1.905 | -13.118 |
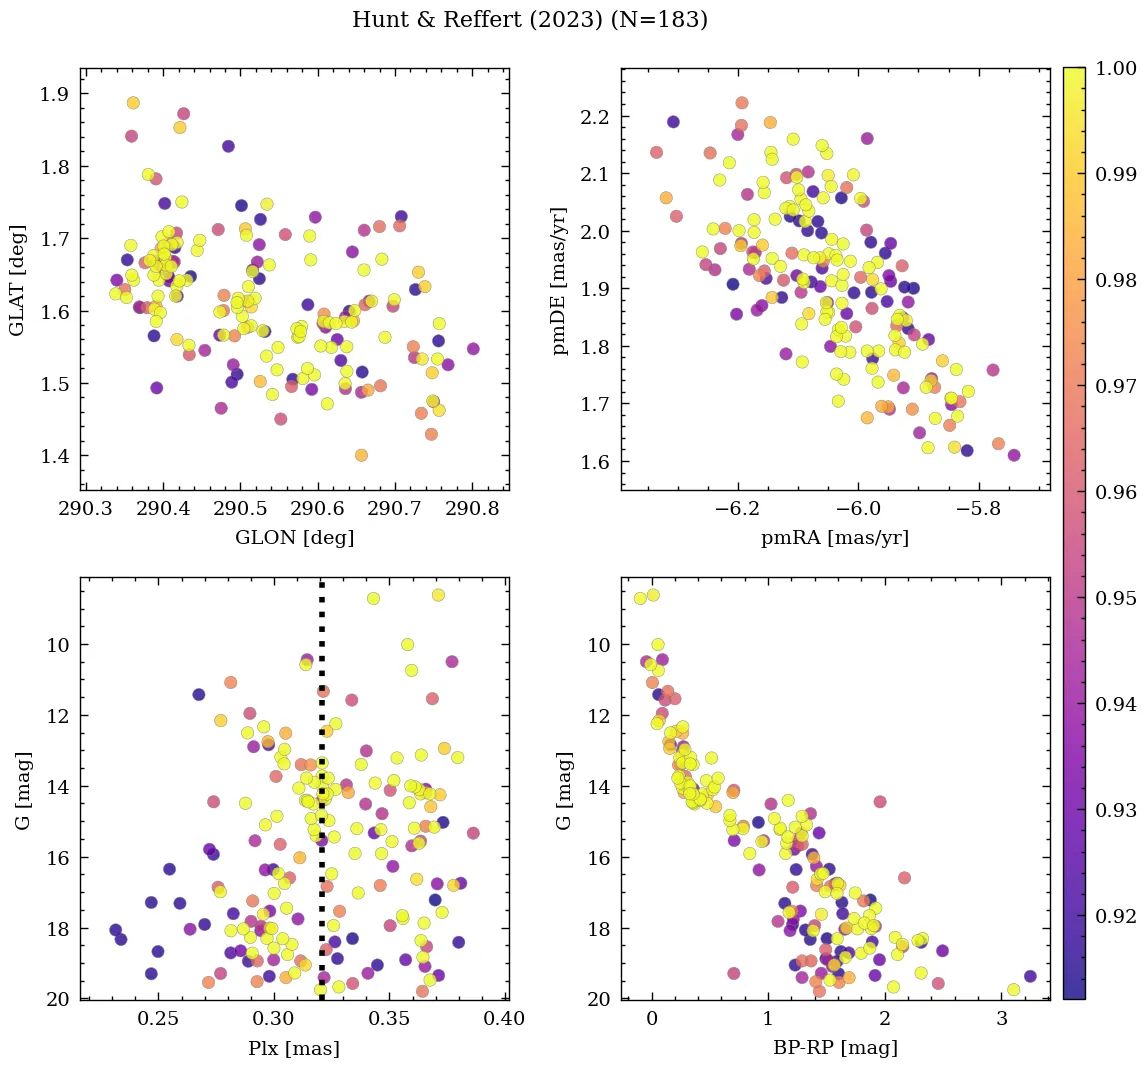
| Hunt & Reffert | 2024 | 168.125 | -58.779 | 0.322 | -6.041 | 1.91 | -8.503 |
| Cavallo et al. | 2024 | 168.304 | -58.874 | 0.326 | – | – | – |
| Hunt & Reffert | 2023 | 168.125 | -58.779 | 0.322 | -6.041 | 1.91 | -8.503 |
| Just et al. | 2023 | 168.239 | -58.877 | – | – | – | – |
| Jaehnig et al. | 2021 | 168.282 | -58.889 | 0.353 | -6.022 | 1.828 | – |
| Loktin & Popova | 2017 | 168.27 | -58.883 | – | -5.49 | -2.72 | 1.0 |
| Kharchenko et al. | 2016 | 168.239 | -58.877 | – | – | – | – |
| Dias et al. | 2014 | 168.271 | -58.883 | – | -5.49 | -2.72 | – |
| Kharchenko et al. | 2013 | 168.247 | -58.88 | – | -9.9 | 1.56 | 1.0 |
| Gozha et al. | 2012 | 168.271 | -58.883 | – | – | – | – |
| Piskunov et al. | 2008 | 168.257 | -58.876 | – | – | – | – |
| Kharchenko et al. | 2007 | 168.27 | -58.88 | – | 0.23 | – | 1.0 |
| Piskunov et al. | 2007 | 168.257 | -58.876 | – | – | – | – |
| van den Bergh | 2006 | 168.275 | -58.883 | – | – | – | – |
| Kharchenko et al. | 2005 | 168.27 | -58.88 | – | -9.8 | 2.91 | 1.0 |
| Kharchenko et al. | 2003 | 168.27 | -58.89 | – | -9.16 | 2.89 | – |
| Dias et al. | 2002 | 168.271 | -58.883 | – | -5.49 | -2.72 | 1.0 |
| Dambis | 1999 | 168.271 | -58.883 | – | – | – | – |
💡 Note: The UCC values are estimated from its identified members.
| Reference | Year | Dist [kpc] | Av [mag] | DAv [mag] | Age [Myr] | [Fe/H] [dex] | Mass [Msun] | Bfrac | BSS |
|---|---|---|---|---|---|---|---|---|---|
| UCC | 99999– | 1.58 | 0.68 | 1.46 | 17 | -0.440 | 519 | – | – |
| Hunt & Reffert | 2024 | – | – | – | – | – | 1101(1) | – | – |
| Cavallo et al. | 2024 | 1.99 | 0.86 | – | 16 | -0.440 | – | – | – |
| Hunt & Reffert | 2023 | 2.87 | 0.81 | 1.46 | 11 | – | – | – | – |
| Just et al. | 2023 | – | – | – | 23 | – | 303 | – | – |
| Jaehnig et al. | 2021 | 2.86(1) | – | – | – | – | – | – | – |
| Loktin & Popova | 2017 | 1.58 | 0.68 | – | 17 | – | – | – | – |
| Kharchenko et al. | 2016 | 1.58 | 0.69 | – | 23 | – | – | – | – |
| Kharchenko et al. | 2013 | 1.58 | 0.69 | – | 23 | – | – | – | – |
| Gozha et al. | 2012 | 1.58 | – | – | 17 | – | 1995 | – | – |
| Piskunov et al. | 2008 | 1.58 | 0.68 | – | 23 | – | 519(1) | – | – |
| Piskunov et al. | 2007 | 1.58 | 0.68 | – | 23 | – | 140 | – | – |
| van den Bergh | 2006 | 1.58 | 0.68 | – | 17 | – | – | – | – |
| Kharchenko et al. | 2005 | 1.58 | 0.68 | – | 23 | – | – | – | – |
| Kharchenko et al. | 2003 | 1.58 | 0.68 | – | – | – | – | – | – |
| Dias et al. | 2002 | 1.58 | 0.68 | – | 17 | – | – | – | – |
| Dambis | 1999 | 2.04 | 0.70 | – | 3 | – | – | – | – |
(N): Indicates that there are N extra values assigned to this parameter in the corresponding reference.
Cavallo et al. (2024)
Gold sample.