Roslund 3
(MWSC 3213; OCL 121; FoF 2069)
0.91
UTI
0.78
CN
1.0
Cdens
0.75
CC3
1.0
Clit
1.0
Cdup
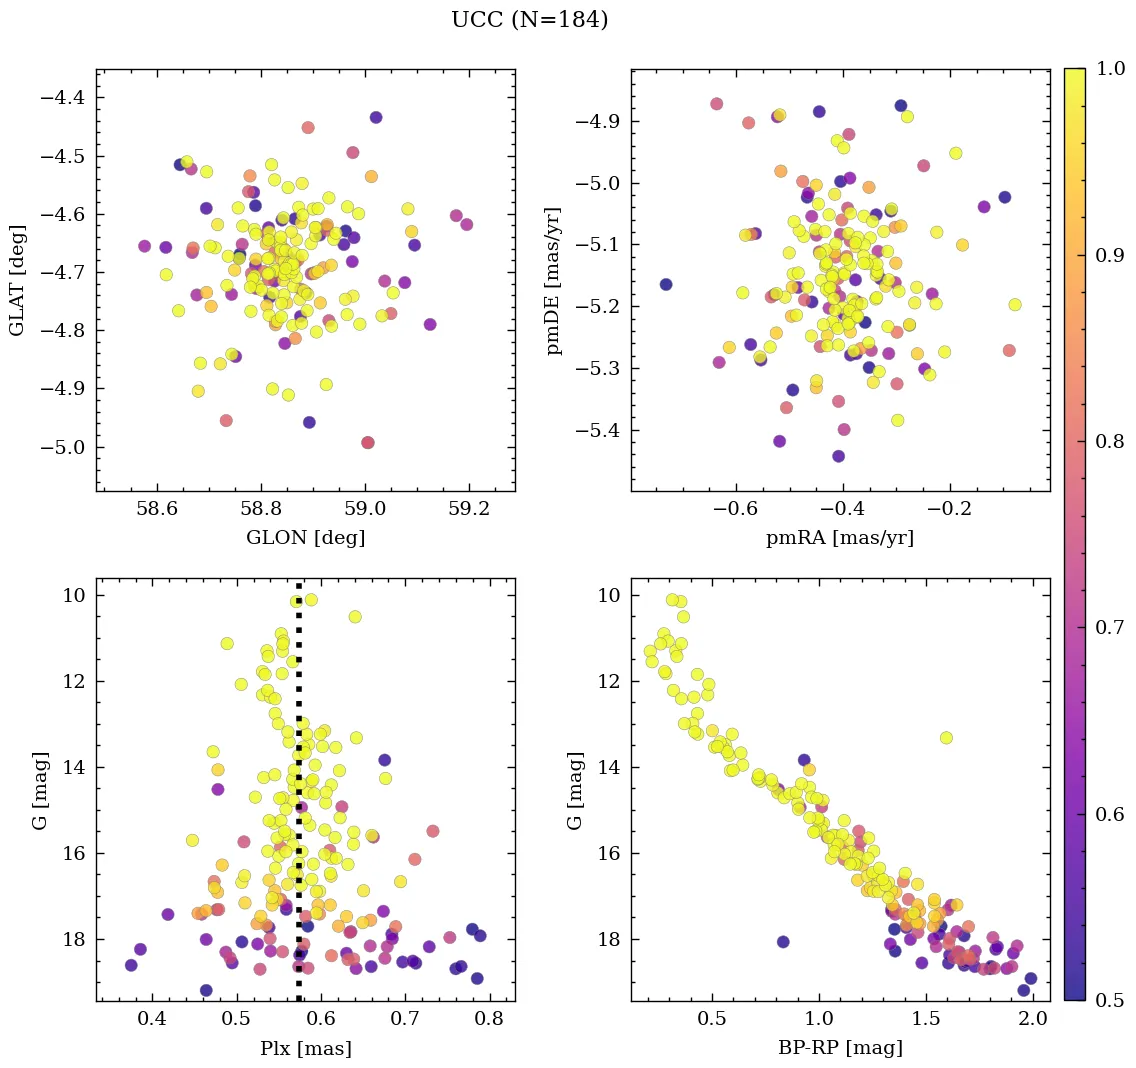
Nm (P>50%)
184
Core radius and density
1.4 [pc], 6.8 [pc-2]
- CN 0.78 Rich
- Cdens 1.0 Very dense
- CC3 0.75 High quality
- Clit 1.0 Very well-studied
- Cdup 1.0 Unique
 MOCA
MOCA
Overview
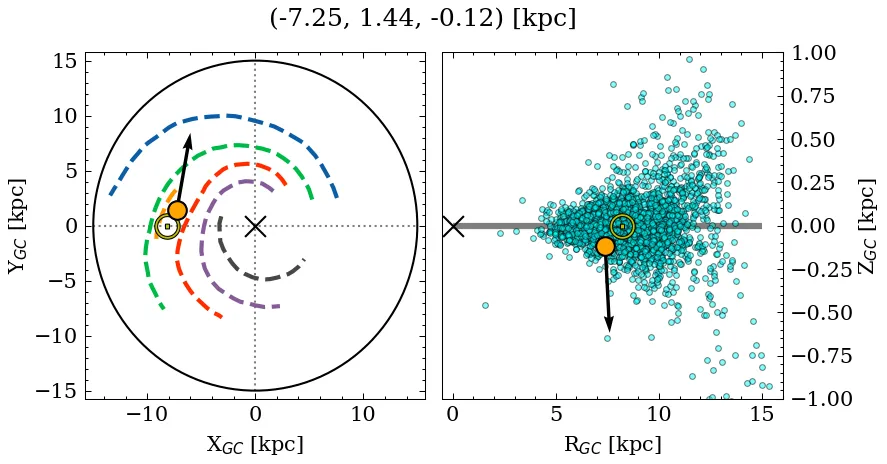
Roslund 3 is a rich, very dense object of high C3 quality. Its parallax locates it at a relatively close distance, below the mid-plane, affected by moderate extinction. It is catalogued as a near-solar metallicity, young cluster, but with a large variance across recent sources for the age, metallicity, and mass parameters (see Parameters). It is very well-studied in the literature.
Note: This object contains blue stragglers according to at least one source.
Data
| Reference | Year | RA [deg] | DEC [deg] | Plx [mas] | pmRA [mas/yr] | pmDE [mas/yr] | Rv [km/s] |
|---|---|---|---|---|---|---|---|
| UCC | 99999– | 299.699 | 20.509 | 0.574 | -0.398 | -5.158 | -9.492 |
| Li et al. | 2026 | 299.7 | 20.51 | – | – | – | – |
| Schweers & McSwain | 2026 | 299.7 | 20.51 | – | – | – | – |
| Li et al. | 2025 | 299.695 | 20.509 | 0.585 | -0.386 | -5.108 | – |
| Almeida et al. | 2025 | 299.695 | 20.51 | – | – | – | – |
| Hunt & Reffert | 2024 | 299.699 | 20.505 | 0.572 | -0.405 | -5.153 | -2.928 |
| Cavallo et al. | 2024 | 299.71 | 20.508 | 0.572 | – | – | – |
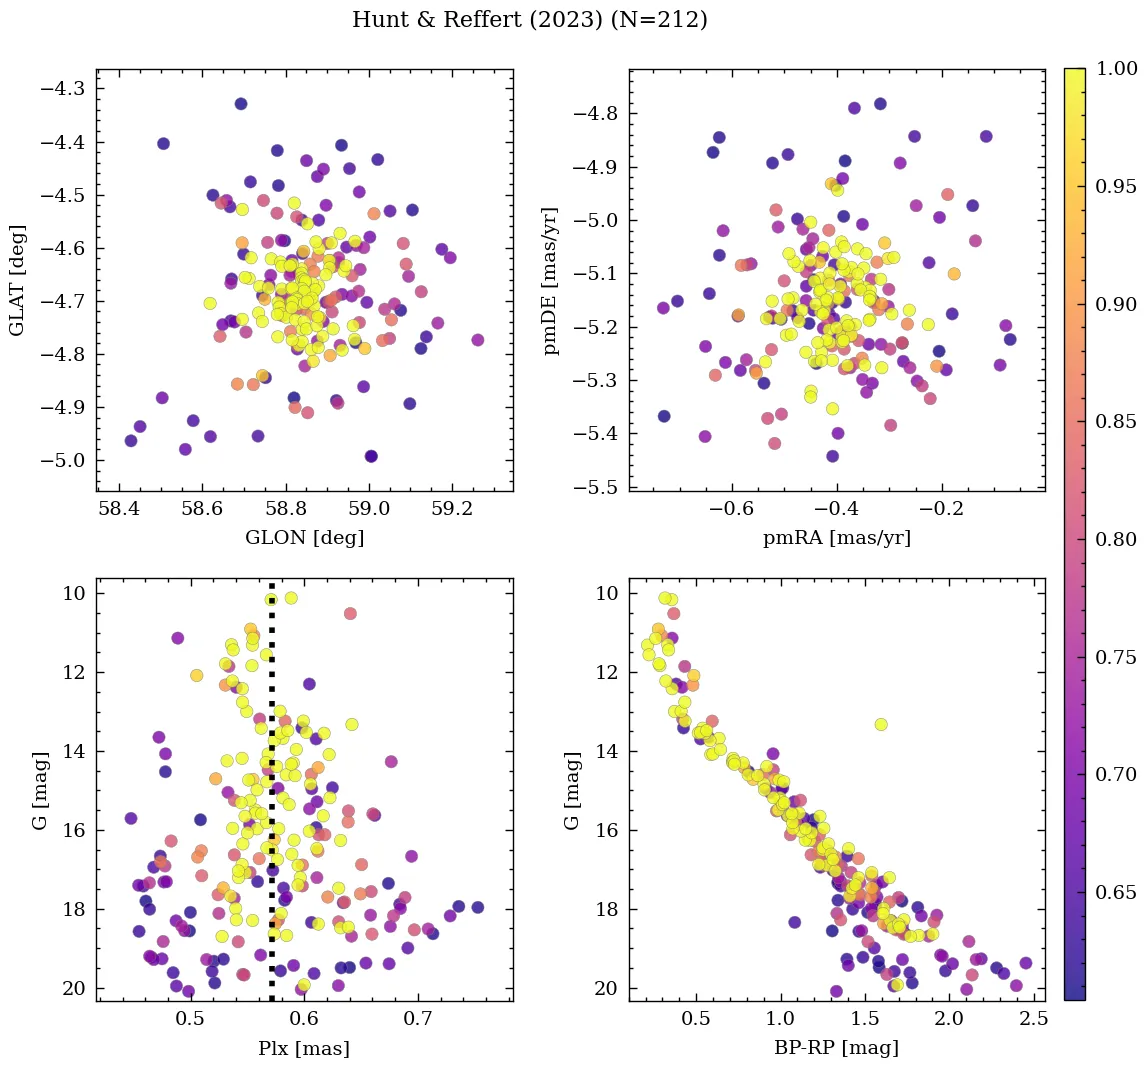
| Hunt & Reffert | 2023 | 299.699 | 20.505 | 0.572 | -0.405 | -5.153 | -2.928 |
| Almeida et al. | 2023 | 299.694 | 20.511 | – | – | – | – |
| Just et al. | 2023 | 299.656 | 20.512 | – | – | – | – |
| Ray et al. | 2022 | 299.695 | 20.509 | – | – | – | – |
| Jaehnig et al. | 2021 | 299.697 | 20.507 | 0.613 | -0.387 | -5.122 | – |
| Rain et al. | 2021 | 299.695 | 20.509 | 0.585 | -0.386 | -5.108 | – |
| Richer et al. | 2021 | 299.685 | 20.495 | 0.582 | -0.388 | -5.119 | – |
| Dias et al. | 2021 | 299.695 | 20.51 | 0.583 | -0.376 | -5.107 | – |
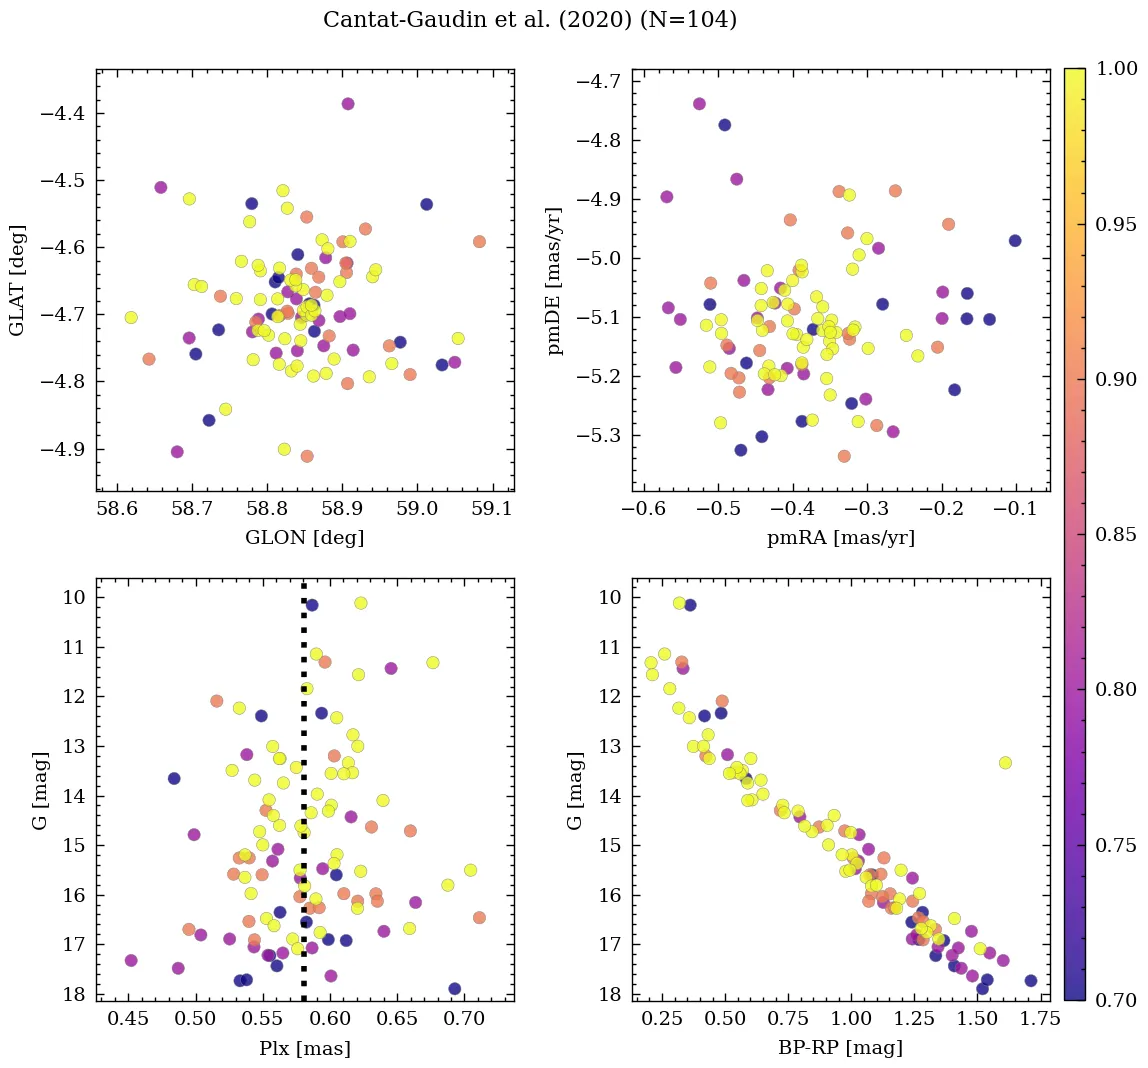
| Cantat-Gaudin et al. | 2020 | 299.695 | 20.509 | 0.585 | -0.386 | -5.108 | – |
| Cantat-Gaudin & Anders | 2020 | 299.695 | 20.509 | 0.585 | -0.386 | -5.108 | – |
| Liu & Pang | 2019 | 299.7 | 20.507 | 0.579 | -0.379 | -5.088 | – |
| Bossini et al. | 2019 | 299.695 | 20.509 | – | – | – | – |
| Soubiran et al. | 2018 | 299.695 | 20.509 | – | – | – | -21.67 |
| Bica et al. | 2019 | 299.684 | 20.501 | – | – | – | – |
| Cantat-Gaudin et al. | 2018 | 299.695 | 20.509 | 0.585 | -0.386 | -5.108 | – |
| Dias et al. | 2018 | – | – | – | -2.44 | -4.75 | – |
| Dib et al. | 2018 | 299.662 | 20.514 | – | – | – | – |
| Loktin & Popova | 2017 | 299.67 | 20.514 | – | -2.385 | -8.765 | -2.6 |
| Sampedro et al. | 2017 | 299.675 | 20.483 | – | 0.6 | -4.85 | – |
| Joshi et al. | 2016 | 299.662 | 20.514 | – | – | – | – |
| Dias et al. | 2016 | 299.675 | 20.483 | – | -0.98 | -4.74 | -4.7 |
| Kharchenko et al. | 2016 | 299.656 | 20.512 | – | – | – | – |
| Dias et al. | 2014 | 299.675 | 20.483 | – | -0.98 | -4.74 | – |
| Kharchenko et al. | 2013 | 299.662 | 20.514 | – | -1.72 | -5.35 | -2.6 |
| Gozha et al. | 2012 | 299.675 | 20.483 | – | – | – | – |
| Kharchenko et al. | 2009 | 299.668 | 20.475 | – | – | – | – |
| Piskunov et al. | 2008 | 299.668 | 20.475 | – | – | – | – |
| Kharchenko et al. | 2007 | 299.67 | 20.48 | – | 0.2 | – | – |
| Piskunov et al. | 2007 | 299.668 | 20.475 | – | – | – | – |
| Ahumada & Lapasset | 2007 | 299.675 | 20.483 | – | – | – | – |
| van den Bergh | 2006 | 299.675 | 20.483 | – | – | – | – |
| Kharchenko et al. | 2005 | 299.67 | 20.48 | – | -0.7 | -3.98 | – |
| Kharchenko et al. | 2003 | 299.67 | 20.52 | – | -1.21 | -5.29 | – |
| Chen et al. | 2003 | 299.686 | 20.465 | – | -1.61 | -5.28 | -4.7 |
| Dias et al. | 2002 | 299.675 | 20.483 | – | -1.61 | -5.28 | -4.7 |
| Lynga | 1987 | 299.673 | 20.484 | – | – | – | – |
| Alter et al. | 1970 | 299.673 | 20.484 | – | – | – | – |
💡 Note: The UCC values are estimated from its identified members.
| Reference | Year | Dist [kpc] | Av [mag] | DAv [mag] | Age [Myr] | [Fe/H] [dex] | Mass [Msun] | Bfrac | BSS |
|---|---|---|---|---|---|---|---|---|---|
| UCC | 99999– | 1.58 | 1.07 | 1.38 | 75 | 0.112 | 508 | 0.58 | 1 |
| Schweers & McSwain | 2026 | 1.50 | – | – | 100 | – | – | – | – |
| Li et al. | 2025 | 1.44 | 0.86 | – | 233 | 0.053 | – | – | – |
| Almeida et al. | 2025 | 1.58 | 1.08 | – | 109 | – | 399 | – | – |
| Hunt & Reffert | 2024 | 1.64 | 0.97 | 1.38 | 75 | – | 793(1) | – | – |
| Cavallo et al. | 2024 | 1.80 | 1.11 | – | 56 | 0.430 | – | – | – |
| Hunt & Reffert | 2023 | 1.64 | 0.97 | 1.38 | 75 | – | – | – | – |
| Almeida et al. | 2023 | 1.62 | 1.15 | – | 105 | 0.112 | 496(1) | 0.58 | – |
| Just et al. | 2023 | – | – | – | 50 | – | 38 | – | – |
| Ray et al. | 2022 | – | – | – | 54 | 0.030(4) | – | – | – |
| Jaehnig et al. | 2021 | 1.63(1) | – | – | – | – | – | – | – |
| Rain et al. | 2021 | 1.63 | 1.04 | – | 44 | – | – | – | 0 |
| Richer et al. | 2021 | – | 1.05 | – | – | – | – | – | – |
| Dias et al. | 2021 | 1.58 | 1.08 | – | 109 | 0.197 | – | – | – |
| Cantat-Gaudin et al. | 2020 | 1.61 | 0.77 | – | 54 | – | – | – | – |
| Kounkel et al. | 2020 | 1.72 | 0.91 | – | 120 | – | – | – | – |
| Cantat-Gaudin & Anders | 2020 | 1.63 | – | – | – | – | – | – | – |
| Liu & Pang | 2019 | – | – | – | 363 | 0.250 | – | – | – |
| Bossini et al. | 2019 | 1.74 | 1.03 | – | 44 | 0.000 | – | – | – |
| Soubiran et al. | 2018 | 1.63 | – | – | – | – | – | – | – |
| Cantat-Gaudin et al. | 2018 | 1.63 | – | – | – | – | – | – | – |
| Dib et al. | 2018 | 1.58 | – | – | 50 | – | – | – | – |
| Loktin & Popova | 2017 | 1.52 | 1.07 | – | 106 | – | – | – | – |
| Joshi et al. | 2016 | 1.58 | 1.02 | – | 50 | – | 724 | – | – |
| Dias et al. | 2016 | 1.47 | 1.10 | – | 109 | – | – | – | – |
| Kharchenko et al. | 2016 | 1.58 | 1.02 | – | 50 | – | – | – | – |
| Kharchenko et al. | 2013 | 1.58 | 1.02 | – | 50 | – | – | – | – |
| Gozha et al. | 2012 | 1.47 | – | – | 109 | – | 724 | – | – |
| Kharchenko et al. | 2009 | 1.51 | 1.07 | – | 41 | – | – | – | – |
| Piskunov et al. | 2008 | 1.51 | 1.07 | – | 41 | – | 519(1) | – | – |
| Piskunov et al. | 2007 | 1.51 | 1.07 | – | 41 | – | 99 | – | – |
| Ahumada & Lapasset | 2007 | – | 1.10 | – | 110 | – | – | – | 2 |
| van den Bergh | 2006 | 1.47 | 1.10 | – | 110 | – | – | – | – |
| Kharchenko et al. | 2005 | 1.51 | 1.07 | – | 41 | – | – | – | – |
| Kharchenko et al. | 2003 | 1.47 | 1.10 | – | – | – | – | – | – |
| Chen et al. | 2003 | 1.47 | – | – | 100 | – | – | – | – |
| Dias et al. | 2002 | 1.47 | 1.10 | – | 109 | – | – | – | – |
(N): Indicates that there are N extra values assigned to this parameter in the corresponding reference.
Li et al. (2026)
Tidal & Core radii: r_t=43+/-41.9 [pc], r_c=0.72+/-0.0 [pc]; stars within r_t: N~154
Almeida et al. (2025)
Mass determination: good fit. Isochrone match: good fit. Silver sample.
Cavallo et al. (2024)
Gold sample.
Hunt & Reffert (2024)
Classified as open cluster. CMD class: 1.00 (50th percentile).
Hunt & Reffert (2023)
Classified as open cluster. CMD class: 1.00 (50th percentile).
Hu et al. (2021)
Ellipticities (core, all): e_core=0.1422, e_all=0.0997.
Rain et al. (2021)
This cluster was include in (Dias et al., 2002A&A...389..871D, Cat. B/ocl) however, parameters log(t)=7.643, Av=1.035, [Fe/H]=0.080 were taken from Bossini et al. (2019A&A...623A.108B, Cat. J/A+A/623/A108). Ahumada & Lapasset (2007A&A...463..789A, Cat. J/A+A/463/789) cite stars DR2 1823376864591083904=HD 350990 and HD 350991 as blue stragglers, HD 350990 is a member according to Cantat-Gaudin et al. (2018A&A...618A..93C, Cat. J/A+A18/A93) however is located in the main sequence of the cluster and not in the straggler region, on the other hand, HD 350991 was not observed by Gaia.
Ahumada & Lapasset (2007)
The dereddened colour-magnitude diagram in (1993A&AS...97..755T) was examined. Adopted cluster centre: star 41 in (1993A&AS...97..755T). Stars A=HD 350990 and B=HD 350991 have spectra B6IIIn and are cluster members (1993A&AS...97..755T). The author assigns the unusual positions of these stars in the colour-magnitude diagram to high rotation velocities.