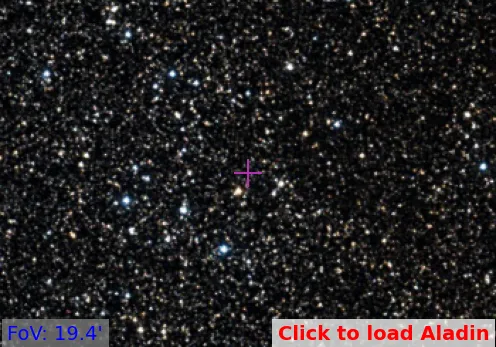
Roslund 1
(MWSC 3169; OCL 112)
0.57
UTI
0.41
CN
0.25
Cdens
0.75
CC3
0.72
Clit
1.0
Cdup
Nm (P>50%)
41
Core radius and density
2.2 [pc], 1.3 [pc-2]
- CN 0.41 Poorly populated
- Cdens 0.25 Loose
- CC3 0.75 High quality
- Clit 0.72 Moderately studied
- Cdup 1.0 Unique
 MOCA
MOCA
Overview
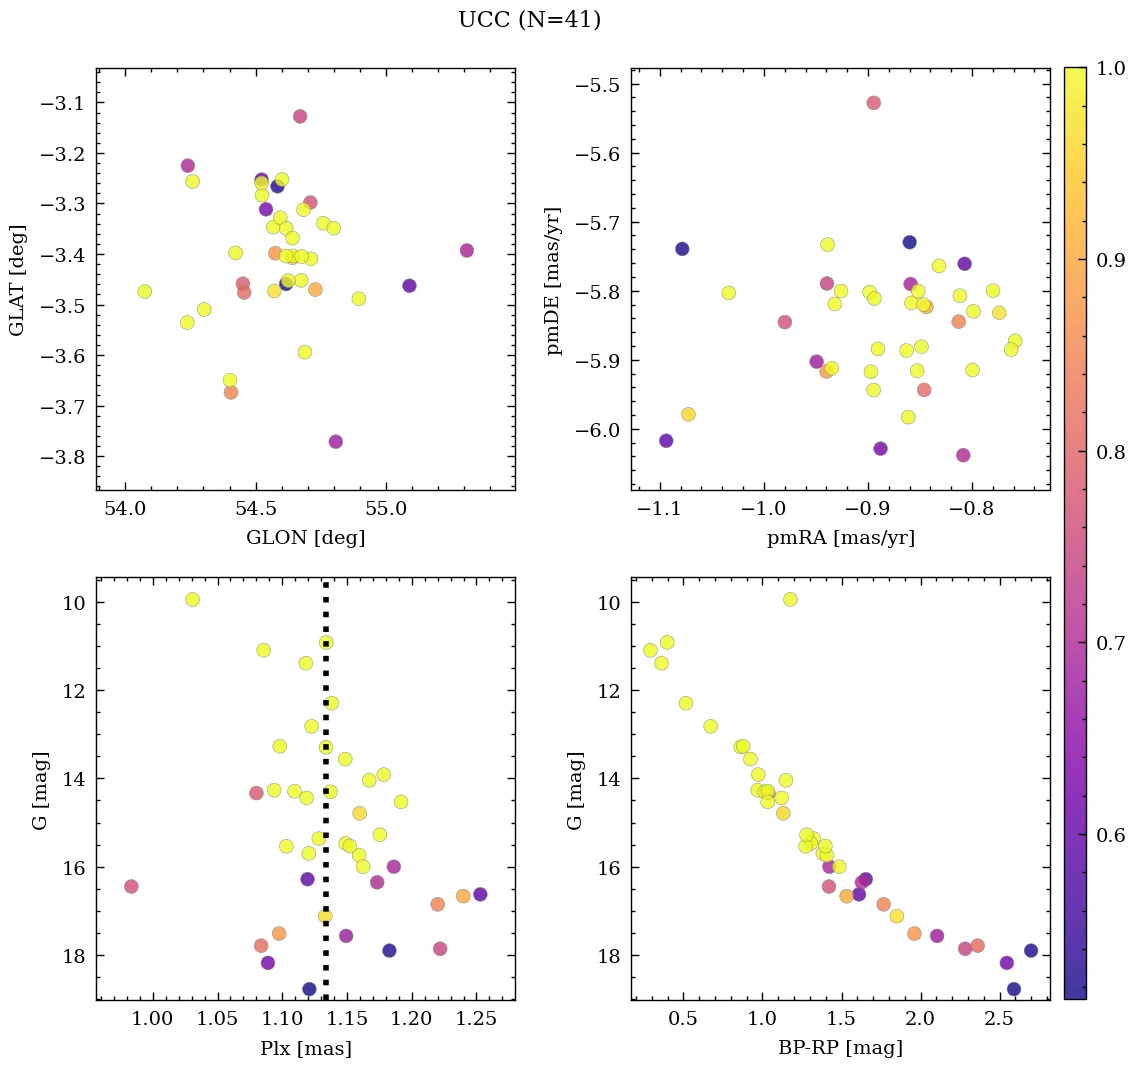
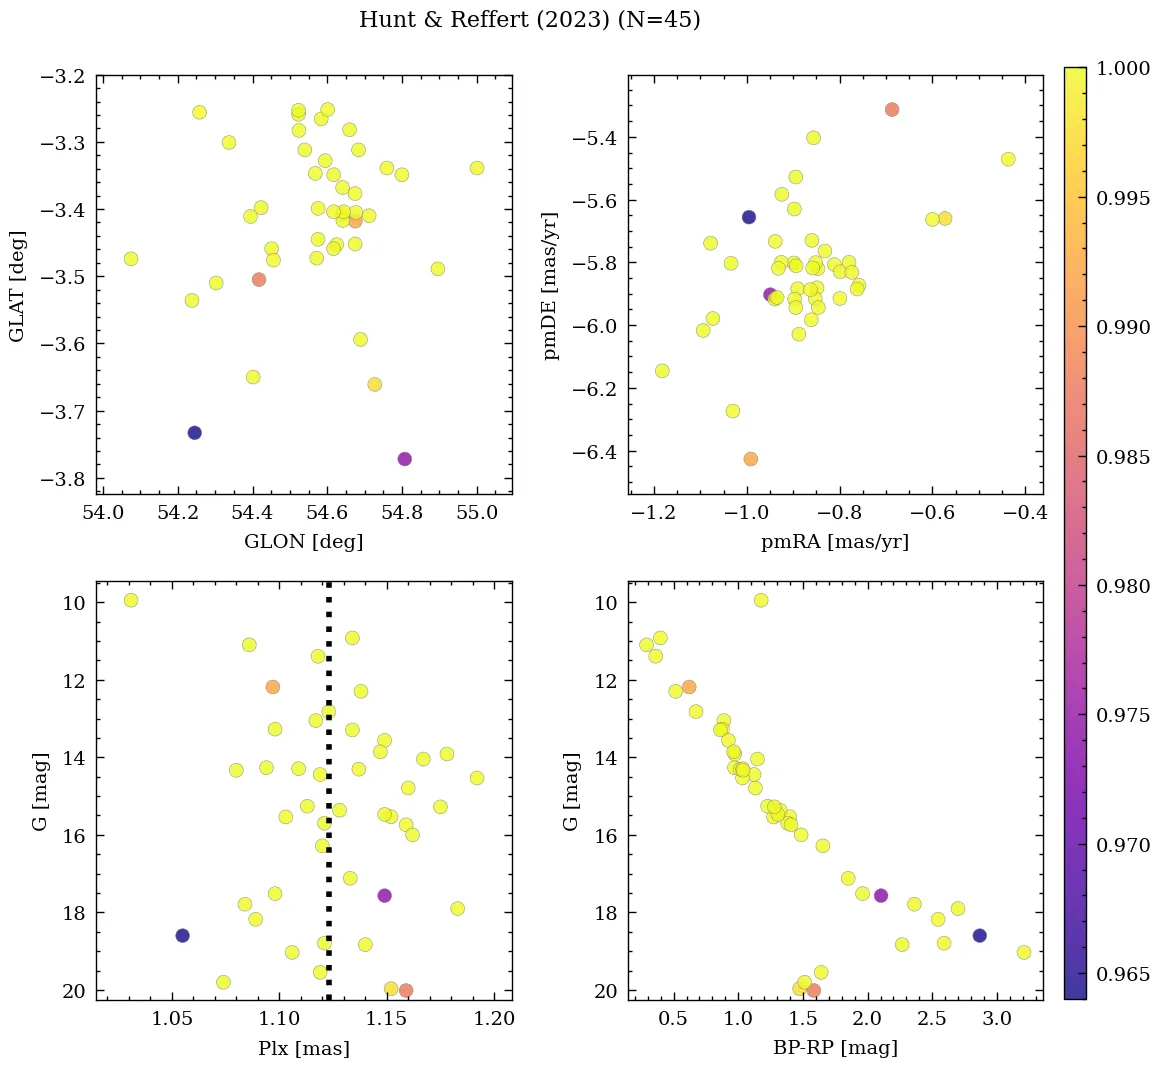
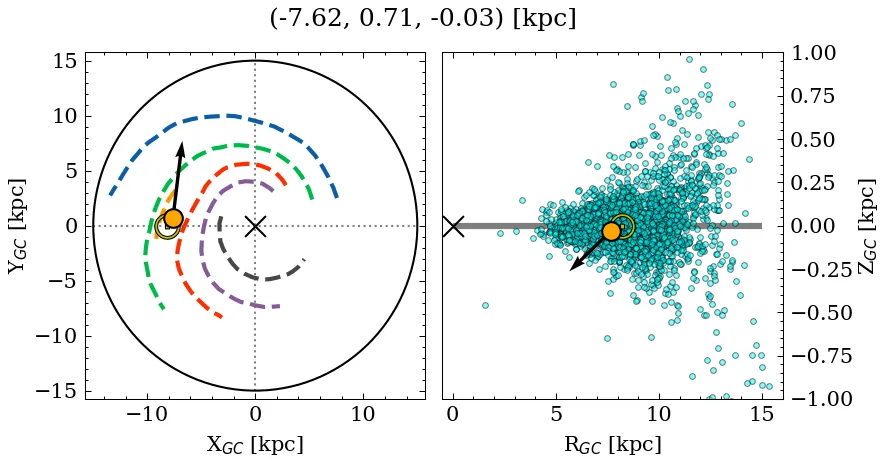
Roslund 1 is a poorly populated, loose object of high C3 quality. Its parallax locates it at a close distance, near the mid-plane, affected by low extinction. It is catalogued as a low-mass, near-solar metallicity, intermediate-age cluster, but with a large variance across recent sources for the absorption and age parameters (see Parameters). It is moderately studied in the literature.
Note: This object shares a significant percentage of members with a later reported entry. See table with shared members information.
Data
| Reference | Year | RA [deg] | DEC [deg] | Plx [mas] | pmRA [mas/yr] | pmDE [mas/yr] | Rv [km/s] |
|---|---|---|---|---|---|---|---|
| UCC | 99999– | 296.243 | 17.523 | 1.134 | -0.861 | -5.832 | -4.783 |
| Hunt & Reffert | 2024 | 296.264 | 17.549 | 1.126 | -0.874 | -5.828 | -5.623 |
| Cavallo et al. | 2024 | 296.247 | 17.491 | 1.129 | – | – | – |
| Hunt & Reffert | 2023 | 296.264 | 17.549 | 1.126 | -0.874 | -5.828 | -5.623 |
| Just et al. | 2023 | 296.273 | 17.508 | – | – | – | – |
| Bica et al. | 2019 | 296.288 | 17.519 | – | – | – | – |
| Dias et al. | 2018 | – | – | – | -1.73 | -4.07 | – |
| Dib et al. | 2018 | 296.28 | 17.51 | – | – | – | – |
| Sampedro et al. | 2017 | 296.25 | 17.517 | – | -4.58 | 0.66 | – |
| Joshi et al. | 2016 | 296.28 | 17.51 | – | – | – | – |
| Dias et al. | 2016 | 296.25 | 17.517 | – | 1.18 | -7.08 | – |
| Kharchenko et al. | 2016 | 296.273 | 17.508 | – | – | – | – |
| Dias et al. | 2014 | 296.25 | 17.517 | – | -2.91 | 0.28 | – |
| Kharchenko et al. | 2013 | 296.28 | 17.51 | – | 0.4 | -7.21 | – |
| Kharchenko et al. | 2009 | 296.241 | 17.522 | – | – | – | – |
| Piskunov et al. | 2008 | 296.241 | 17.522 | – | – | – | – |
| Kharchenko et al. | 2005 | 296.25 | 17.52 | – | 1.18 | -7.08 | – |
| Kharchenko et al. | 2003 | 296.28 | 17.53 | – | 0.01 | -4.63 | – |
| Dias et al. | 2002 | 296.25 | 17.517 | – | – | – | – |
| Lynga | 1987 | 296.289 | 17.542 | – | – | – | – |
| Alter et al. | 1970 | 296.279 | 17.524 | – | – | – | – |
💡 Note: The UCC values are estimated from its identified members.
| Reference | Year | Dist [kpc] | Av [mag] | DAv [mag] | Age [Myr] | [Fe/H] [dex] | Mass [Msun] | Bfrac | BSS |
|---|---|---|---|---|---|---|---|---|---|
| UCC | 99999– | 0.79 | 0.16 | 0.81 | 295 | 0.190 | 25 | – | – |
| Liu et al. | 2025 | 1.15 | 0.32 | – | 54 | – | – | – | – |
| Hunt & Reffert | 2024 | 0.85 | 0.99 | 0.81 | 169 | – | 115(1) | – | – |
| Cavallo et al. | 2024 | 0.86 | 1.15 | – | 105 | 0.190 | – | – | – |
| Hunt & Reffert | 2023 | 0.85 | 0.99 | 0.81 | 169 | – | – | – | – |
| Just et al. | 2023 | – | – | – | 582 | – | 13 | – | – |
| Dib et al. | 2018 | 0.79 | – | – | 582 | – | – | – | – |
| Joshi et al. | 2016 | 0.79 | 0.16 | – | 582 | – | 25 | – | – |
| Dias et al. | 2016 | 0.67 | 0.16 | – | 295 | – | – | – | – |
| Kharchenko et al. | 2016 | 0.79 | 0.16 | – | 582 | – | – | – | – |
| Kharchenko et al. | 2013 | 0.79 | 0.16 | – | 582 | – | – | – | – |
| Kharchenko et al. | 2009 | 0.67 | 0.16 | – | 295 | – | – | – | – |
| Piskunov et al. | 2008 | 0.67 | 0.16 | – | 295 | – | – | – | – |
| Kharchenko et al. | 2005 | 0.67 | 0.16 | – | 295 | – | – | – | – |
| Kharchenko et al. | 2003 | 0.83 | 0.47 | – | – | – | – | – | – |
(N): Indicates that there are N extra values assigned to this parameter in the corresponding reference.
Liu et al. (2025)
Classified as primordial binary cluster 301 along with OC_0077.
Palma et al. (2025)
Classified as optical pair P157, along with HSC_450.
Cavallo et al. (2024)
Gold sample.
Hunt & Reffert (2024)
Classified as open cluster. CMD class: 0.97 (50th percentile).
Hunt & Reffert (2023)
Classified as open cluster. CMD class: 0.97 (50th percentile).