Pismis 4
(FoF 2289)
0.96
UTI
0.79
CN
1.0
Cdens
1.0
CC3
1.0
Clit
1.0
Cdup
Stellar density (N50/rad)
14.1 [N/pc2]
- CN 0.79 Rich
- Cdens 1.0 Very dense
- CC3 1.0 Very high quality
- Clit 1.0 Very well-studied
- Cdup 1.0 Unique
 MOCA
MOCA
Overview
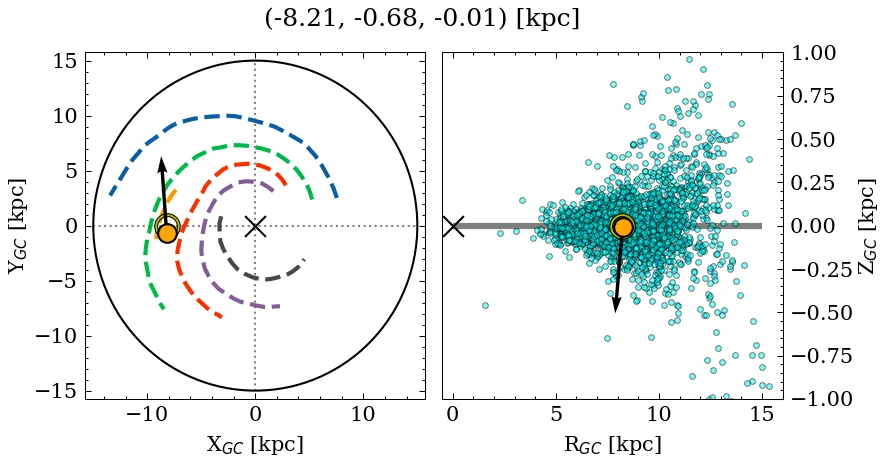
Pismis 4 is a rich, very dense object of very high C3 quality. Its parallax locates it at a close distance, near the mid-plane, affected by low extinction. It is catalogued as a near-solar metallicity, intermediate-age cluster (see Parameters). It is very well-studied in the literature.
Data
| Reference | Year | RA [deg] | DEC [deg] | Plx [mas] | pmRA [mas/yr] | pmDE [mas/yr] | Rv [km/s] |
|---|---|---|---|---|---|---|---|
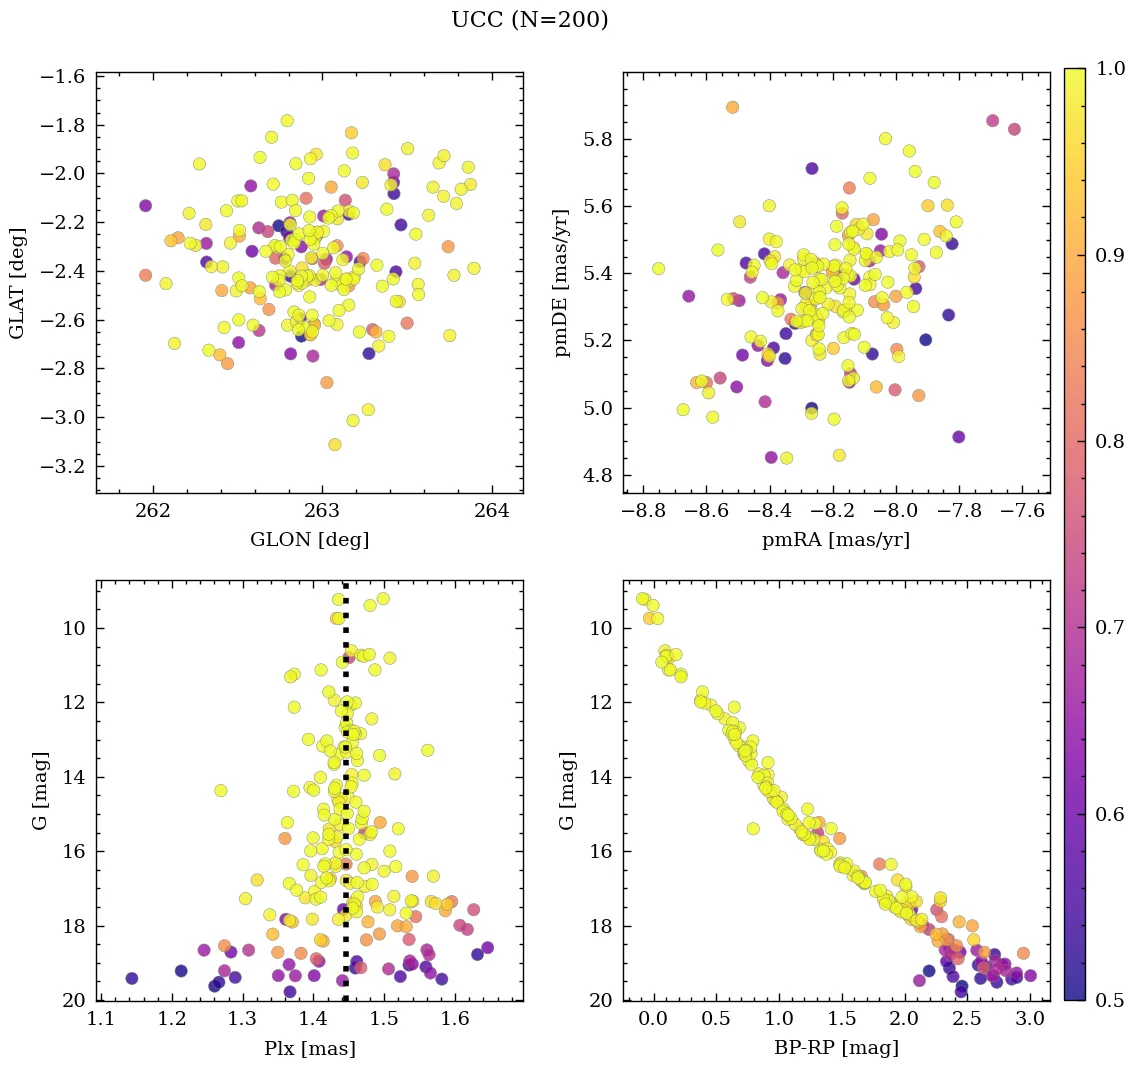
| UCC | 99999– | 128.797 | -44.421 | 1.446 | -8.198 | 5.355 | 7.988 |
| Yan et al. | 2026 | 128.769 | -44.404 | 1.438 | -8.224 | 5.404 | – |
| Li et al. | 2025 | 128.79 | -44.407 | 1.414 | -8.236 | 5.337 | – |
| Almeida et al. | 2025 | 128.77 | -44.391 | – | – | – | – |
| Alfonso et al. | 2024 | 128.829 | -44.559 | 1.419 | -8.214 | 5.408 | – |
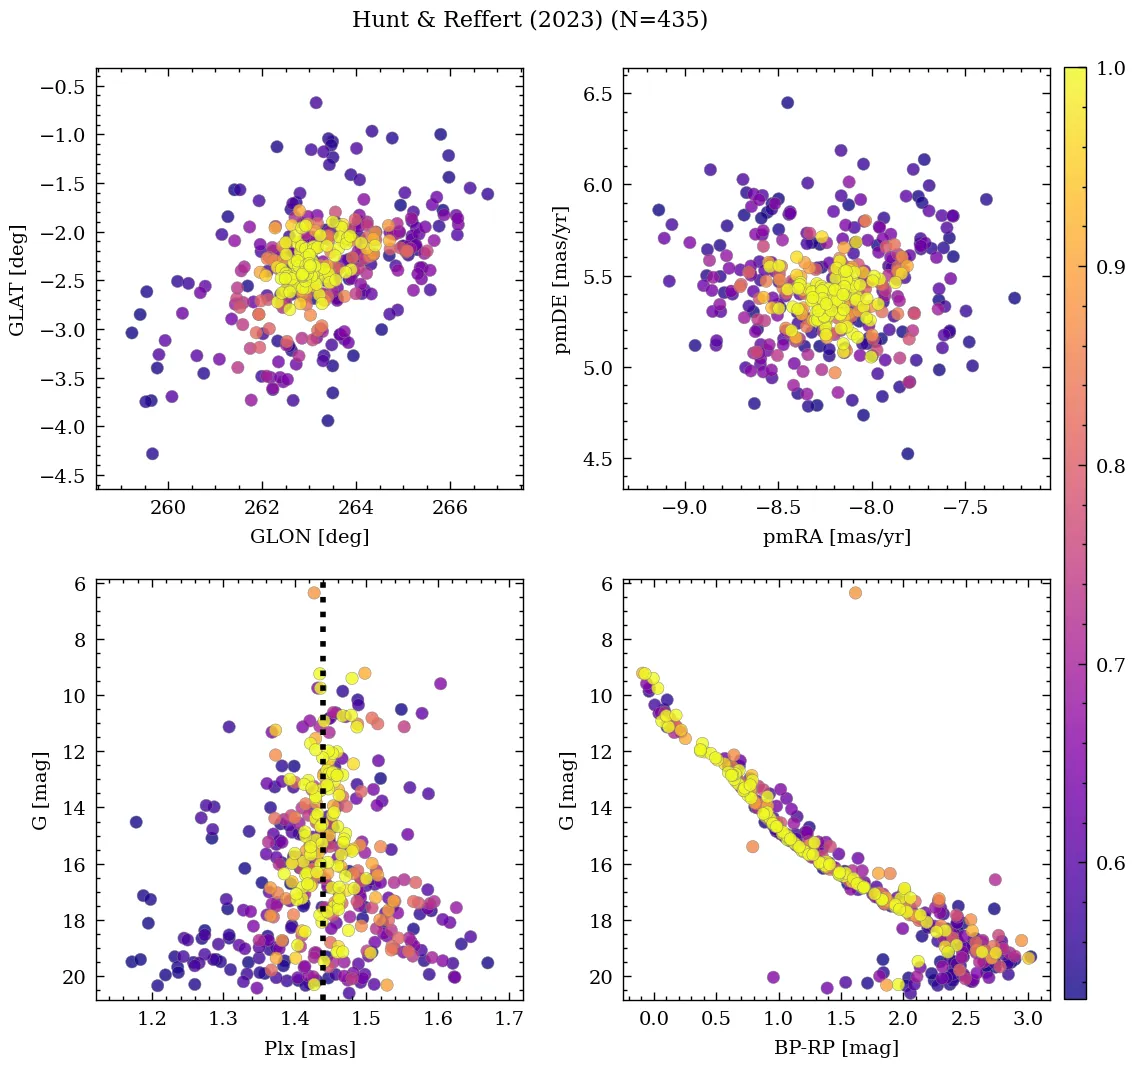
| Hunt & Reffert | 2024 | 128.769 | -44.404 | 1.438 | -8.224 | 5.404 | 8.408 |
| Cavallo et al. | 2024 | 129.037 | -44.663 | 1.445 | – | – | – |
| Hunt & Reffert | 2023 | 128.769 | -44.404 | 1.438 | -8.224 | 5.404 | 8.408 |
| Almeida et al. | 2023 | 128.801 | -44.446 | – | – | – | – |
| Cordoni et al. | 2023 | 128.77 | -44.391 | 1.407 | -8.235 | 5.343 | – |
| He et al. | 2022 | 128.911 | -44.411 | 1.452 | -8.197 | 5.396 | – |
| Tarricq et al. | 2022 | 128.82 | -44.492 | 1.429 | -8.182 | 5.391 | – |
| Jaehnig et al. | 2021 | 128.723 | -44.411 | 1.449 | -8.215 | 5.35 | – |
| Rain et al. | 2021 | 128.79 | -44.407 | 1.414 | -8.236 | 5.337 | – |
| Richer et al. | 2021 | 128.719 | -44.431 | 1.439 | -8.2 | 5.331 | – |
| Dias et al. | 2021 | 128.77 | -44.391 | 1.407 | -8.235 | 5.343 | 7.334 |
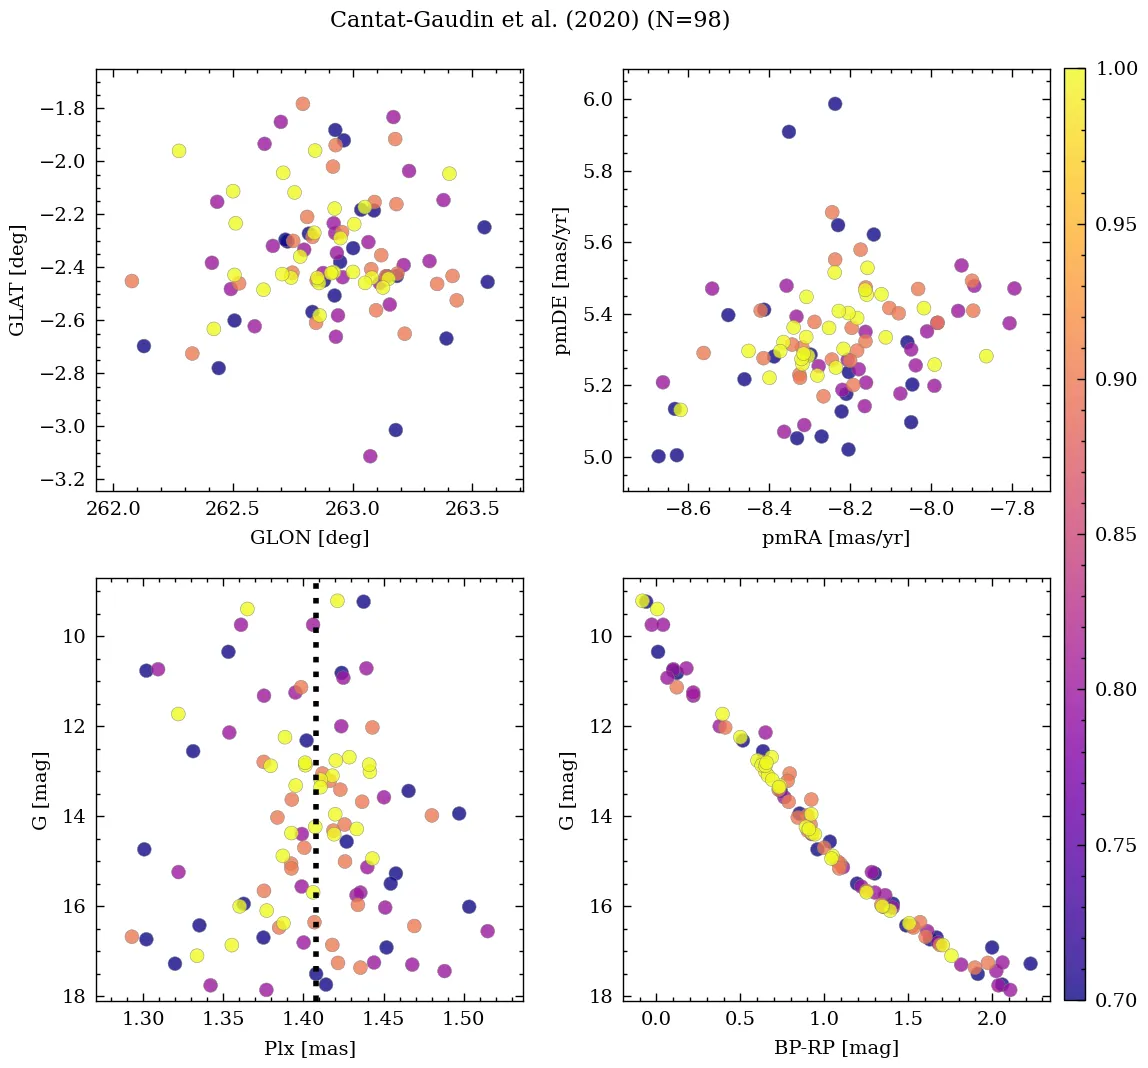
| Cantat-Gaudin et al. | 2020 | 128.79 | -44.407 | 1.414 | -8.236 | 5.337 | – |
| Cantat-Gaudin & Anders | 2020 | 128.79 | -44.407 | 1.414 | -8.236 | 5.337 | – |
| Liu & Pang | 2019 | 128.795 | -44.462 | 1.416 | -8.217 | 5.326 | – |
| Bossini et al. | 2019 | 128.79 | -44.407 | – | – | – | – |
| Soubiran et al. | 2018 | 128.79 | -44.407 | – | – | – | 11.59 |
| Cantat-Gaudin et al. | 2018 | 128.79 | -44.407 | 1.414 | -8.236 | 5.337 | – |
| Loktin & Popova | 2017 | 128.655 | -44.417 | – | -2.68 | 1.27 | 27.2 |
| Dias et al. | 2014 | 128.65 | -44.417 | – | -2.68 | 1.27 | – |
| Gozha et al. | 2012 | 128.65 | -44.417 | – | – | – | – |
| Piskunov et al. | 2008 | 128.654 | -44.473 | – | – | – | – |
| Kharchenko et al. | 2007 | 128.65 | -44.42 | – | 0.4 | – | 30.0 |
| Piskunov et al. | 2007 | 128.654 | -44.473 | – | – | – | – |
| Ahumada & Lapasset | 2007 | 128.65 | -44.417 | – | – | – | – |
| van den Bergh | 2006 | 128.675 | -44.395 | – | – | – | – |
| Kharchenko et al. | 2005 | 128.65 | -44.48 | – | -5.55 | 5.75 | – |
| Kharchenko et al. | 2003 | 128.67 | -44.34 | – | -6.53 | 5.64 | – |
| Chen et al. | 2003 | 128.657 | -44.409 | – | – | – | – |
| Dias et al. | 2002 | 128.65 | -44.417 | – | -2.68 | 1.27 | 30.0 |
| Dambis | 1999 | 128.675 | -44.395 | – | – | – | – |
| Lynga | 1987 | 128.624 | -44.277 | – | – | – | – |
| van den Bergh & Hagen | 1975 | 128.2 | -44.1 | – | – | – | – |
💡 Note: The UCC values are estimated from its identified members.
| Reference | Year | Dist [kpc] | Av [mag] | DAv [mag] | Age [Myr] | [Fe/H] [dex] | Mass [Msun] | Bfrac | BSS |
|---|---|---|---|---|---|---|---|---|---|
| UCC | 99999– | 0.675 | 0.09 | 0.7 | 109 | -0.089 | 296 | 0.39 | 0 |
| Yan et al. | 2026 | – | – | – | 120 | – | – | – | – |
| Li et al. | 2025 | 0.71 | 0.22 | – | 126 | 0.053 | – | – | – |
| Almeida et al. | 2025 | 0.69 | 0.29 | – | 124 | – | 239 | – | – |
| Alfonso et al. | 2024 | 0.69 | 0.18 | – | 175 | -0.088 | – | – | – |
| Hunt & Reffert | 2024 | – | – | – | – | – | 347(1) | – | – |
| Cavallo et al. | 2024 | 0.70 | 0.43 | – | 89 | 0.010 | – | – | – |
| Hunt & Reffert | 2023 | 0.66 | 0.13 | 0.70 | 116 | – | – | – | – |
| Almeida et al. | 2023 | 0.68 | 0.21 | – | 202 | -0.051 | 235(1) | 0.45 | – |
| Cordoni et al. | 2023 | 0.69 | 0.29 | – | 124 | -0.089 | 296 | 0.33 | 0(1) |
| He et al. | 2022 | – | 0.30 | – | 79 | – | – | – | – |
| Tarricq et al. | 2022 | 0.68 | – | – | 132 | – | – | – | – |
| Jaehnig et al. | 2021 | 0.69(1) | – | – | – | – | – | – | – |
| Rain et al. | 2021 | 0.69 | 0.09 | – | 79 | – | – | – | 0 |
| Richer et al. | 2021 | – | 0.22 | – | 120 | – | – | – | – |
| Dias et al. | 2021 | 0.69 | 0.29 | – | 124 | -0.089 | – | – | – |
| Cantat-Gaudin et al. | 2020 | 0.70 | 0.18 | – | 120 | – | – | – | – |
| Kounkel et al. | 2020 | 0.67 | 0.38 | – | 102 | – | – | – | – |
| Cantat-Gaudin & Anders | 2020 | 0.69 | – | – | – | – | – | – | – |
| Liu & Pang | 2019 | – | – | – | 41 | 0.000 | – | – | – |
| Bossini et al. | 2019 | 0.66 | 0.09 | – | 80 | -0.200 | – | – | – |
| Soubiran et al. | 2018 | 0.69 | – | – | – | – | – | – | – |
| Cantat-Gaudin et al. | 2018 | 0.69 | – | – | – | – | – | – | – |
| Loktin & Popova | 2017 | 0.60 | 0.04 | – | 34 | – | – | – | – |
| Gozha et al. | 2012 | 0.59 | – | – | 34 | -0.110 | 302 | – | – |
| Piskunov et al. | 2008 | 0.59 | 0.03 | – | 129 | – | 317(1) | – | – |
| Piskunov et al. | 2007 | 0.59 | 0.03 | – | 129 | – | 121 | – | – |
| Ahumada & Lapasset | 2007 | – | 0.03 | – | 34 | – | – | – | 0 |
| van den Bergh | 2006 | 0.59 | 0.03 | – | 34 | – | – | – | – |
| Kharchenko et al. | 2005 | 0.59 | 0.03 | – | 129 | – | – | – | – |
| Kharchenko et al. | 2003 | 0.59 | 0.03 | – | – | – | – | – | – |
| Chen et al. | 2003 | 0.59 | 0.04 | – | 30 | -0.200(1) | – | – | – |
| Dias et al. | 2002 | 0.59 | 0.04 | – | 34 | -0.200 | – | – | – |
| Dambis | 1999 | 0.56 | 0.03 | – | 40 | – | – | – | – |
| Lynga | 1987 | 0.60 | 0.06 | – | 25 | – | – | – | – |
(N): Indicates that there are N extra values assigned to this parameter in the corresponding reference.
Yan et al. (2026)
Number of WDs: expected from single-star evolution N=5, with probability of formation through binary evolution >=0.5 N=1.
Palma et al. (2025)
Part of multiple system G140, along with IC_2395, HSC_2147, Theia_110 and HSC_2093.
Almeida et al. (2025)
Mass determination: good fit. Isochrone match: good fit.
Cavallo et al. (2024)
Gold sample.
Hunt & Reffert (2024)
Classified as open cluster. CMD class: 1.00 (50th percentile).
Richer et al. (2021)
The expected number of WDs is 3.4, 0 WD candidates found, and 3 WD candidates found in the wide search.
Rain et al. (2021)
This cluster was include in (Dias et al., 2002A&A...389..871D, Cat. B/ocl) however, parameters log(t)=7.905, Av=0.093, [Fe/H]=-0.200 were taken from Bossini et al. (2019A&A...623A.108B, Cat. J/A+A/623/A108).