NGC 7789
(Melotte 245; Collinder 460; MWSC 3779; OCL 269; FSR 0450; FoF 49)
1.0
UTI
1.0
CN
1.0
Cdens
1.0
CC3
1.0
Clit
1.0
Cdup
N50 (P>50% members)
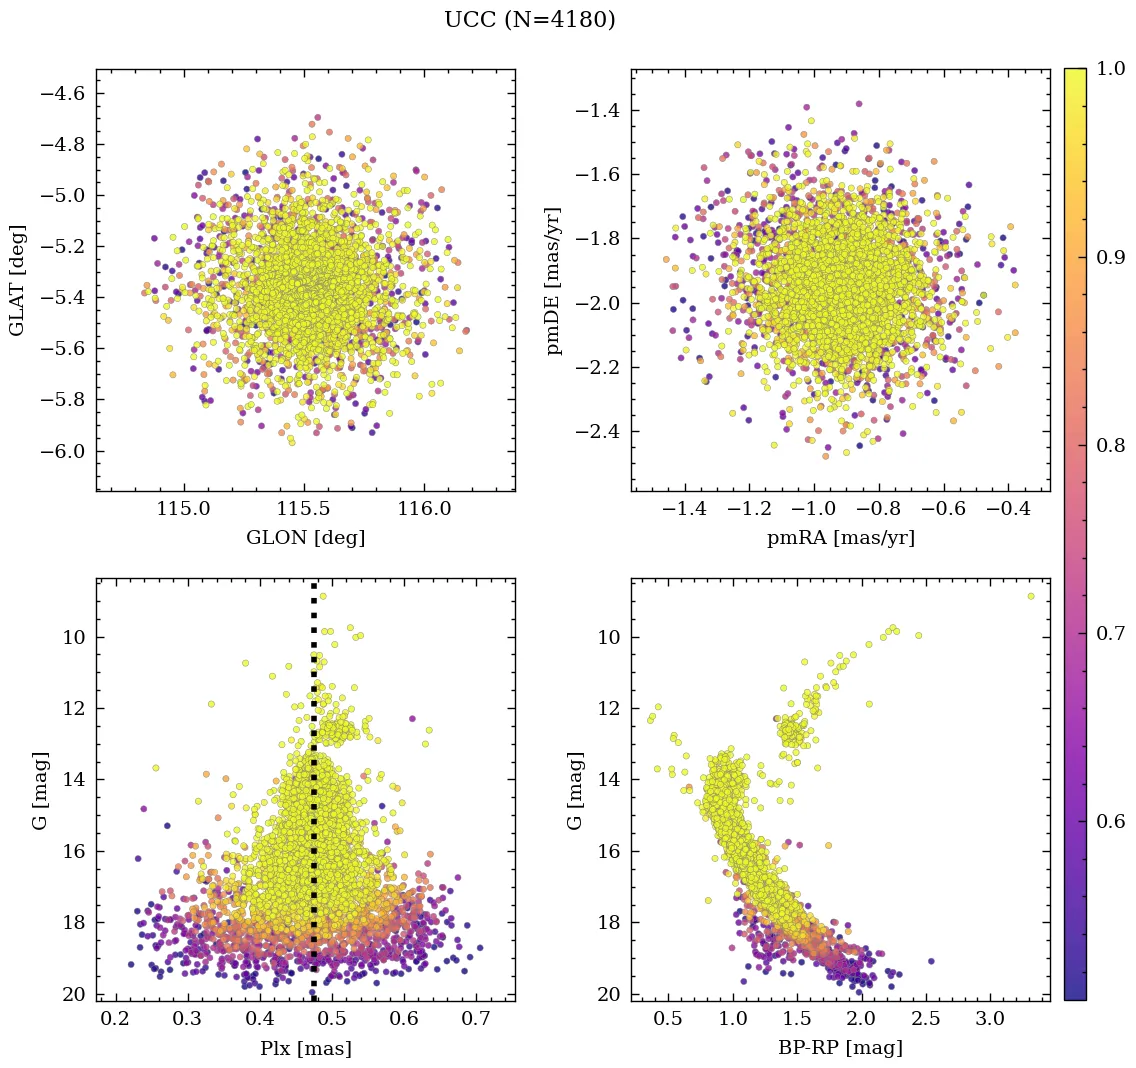
4180
Stellar density (N50/rad)
103.3 [N/pc2]
- CN 1.0 Very rich
- Cdens 1.0 Very dense
- CC3 1.0 Very high quality
- Clit 1.0 Very well-studied
- Cdup 1.0 Unique
 MOCA
MOCA
Overview
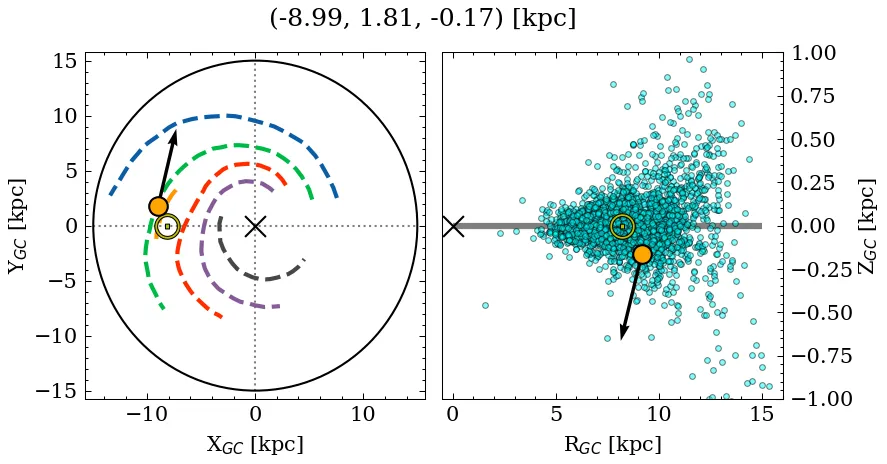
NGC 7789 is a very rich, very dense object of very high C3 quality. Its parallax locates it at a moderate distance, below the mid-plane, affected by low extinction. It is catalogued as a very massive, near-solar metallicity, old cluster, but with a large variance across recent sources for the mass parameter (see Parameters). It is very well-studied in the literature.
Note: This object contains blue stragglers according to at least one source.
Data
| Reference | Year | RA [deg] | DEC [deg] | Plx [mas] | pmRA [mas/yr] | pmDE [mas/yr] | Rv [km/s] |
|---|---|---|---|---|---|---|---|
| UCC | 99999– | 359.313 | 56.725 | 0.476 | -0.918 | -1.952 | -54.219 |
| Bijavara Seshashayana et al. | 2025 | 359.264 | 56.714 | – | – | – | – |
| Otto et al. | 2026 | 359.329 | 56.724 | – | -0.92 | -1.93 | -53.2 |
| Li et al. | 2025 | -0.666 | 56.726 | 0.453 | -0.922 | -1.933 | – |
| Guerco et al. | 2025 | 359.0 | 56.8 | 0.5 | -0.94 | -2.02 | -54.4 |
| Hu & Soubiran | 2025 | 359.329 | 56.726 | – | – | – | – |
| Carrasco-Varela et al. | 2025 | 359.562 | 56.792 | – | – | – | – |
| Zhang et al. | 2024 | 359.329 | 56.724 | – | – | – | – |
| Hunt & Reffert | 2024 | 359.329 | 56.724 | 0.479 | -0.914 | -1.952 | -53.867 |
| Cavallo et al. | 2024 | 359.329 | 56.726 | 0.479 | – | – | – |
| Rain et al. | 2024 | 359.335 | 56.724 | 0.478 | -0.917 | -1.957 | – |
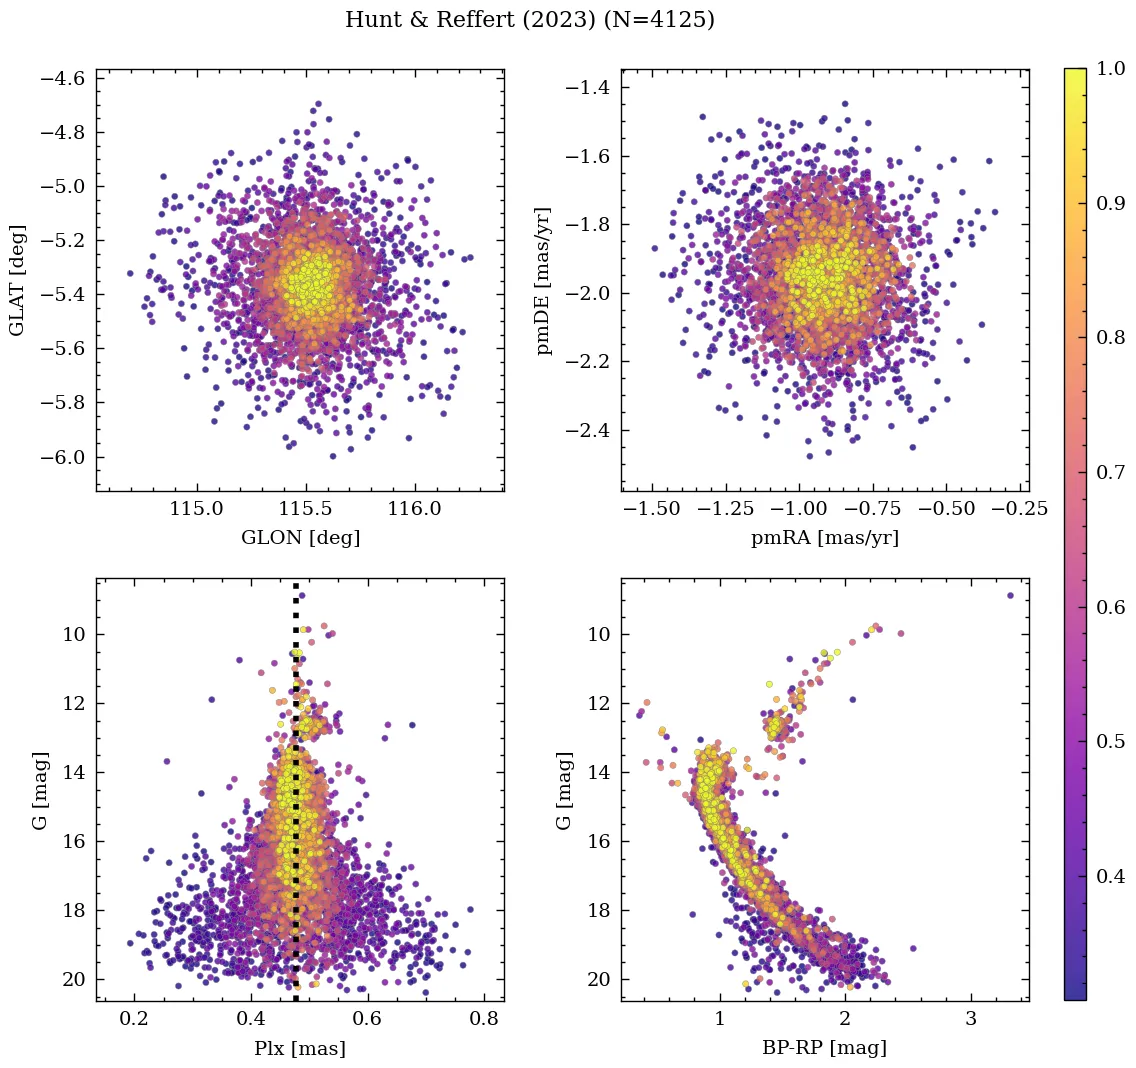
| Hunt & Reffert | 2023 | 359.329 | 56.724 | 0.479 | -0.914 | -1.952 | -53.867 |
| Angelo et al. | 2023 | 359.387 | 56.724 | – | -0.92 | -1.95 | – |
| Just et al. | 2023 | 359.347 | 56.726 | – | – | – | – |
| Jadhav & Subramaniam | 2021 | -0.666 | 56.726 | – | – | – | – |
| Jaehnig et al. | 2021 | 359.341 | 56.727 | 0.483 | -0.925 | -1.933 | – |
| Rain et al. | 2021 | 359.334 | 56.726 | 0.453 | -0.922 | -1.933 | – |
| Dias et al. | 2021 | 342.296 | 56.727 | 0.449 | -0.926 | -1.931 | -54.059 |
| Spina et al. | 2021 | 359.303 | 56.725 | 0.451 | -0.926 | -1.93 | – |
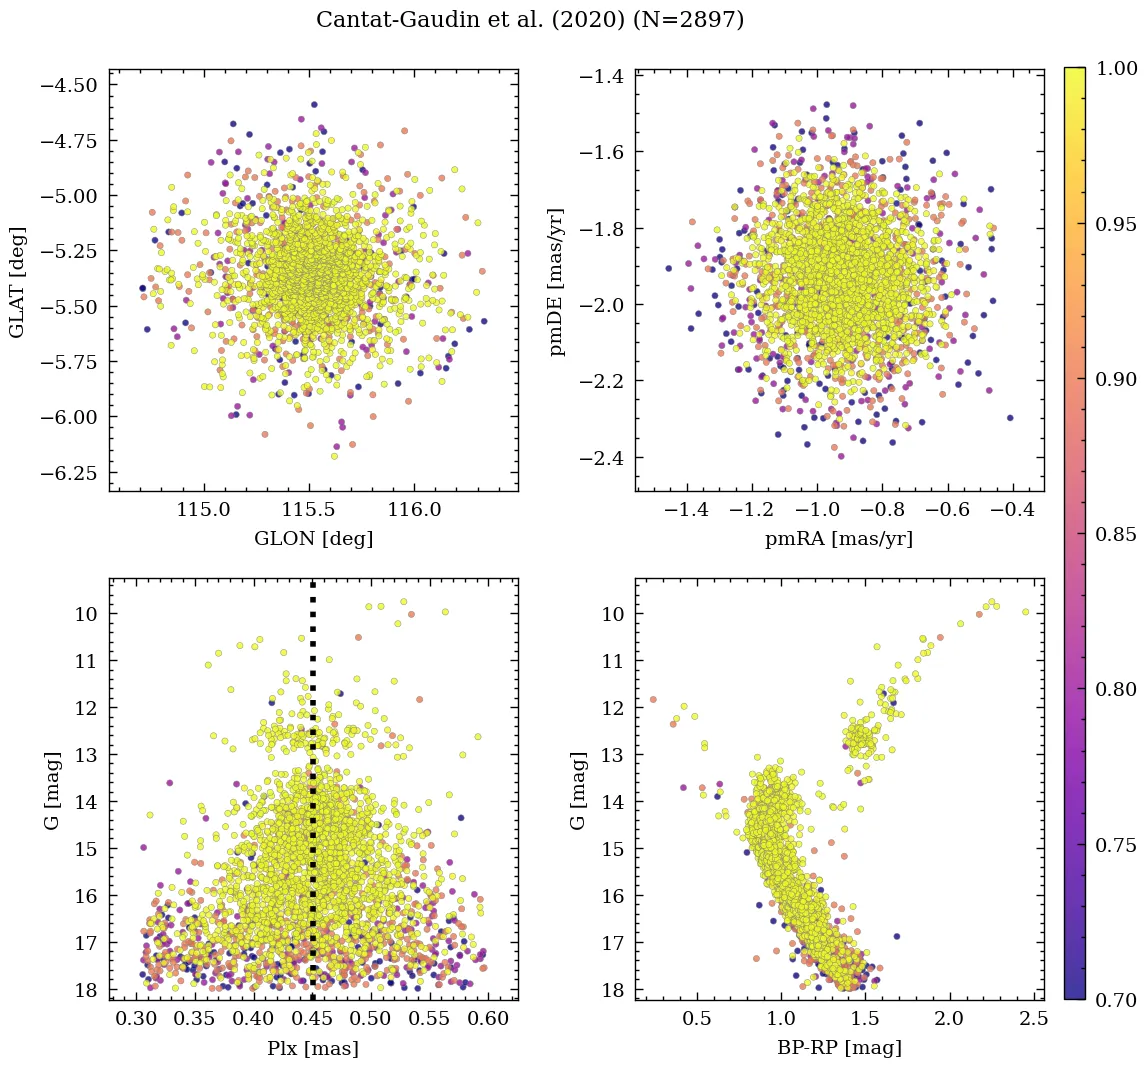
| Cantat-Gaudin et al. | 2020 | -0.666 | 56.726 | 0.453 | -0.922 | -1.933 | – |
| Donor et al. | 2020 | 359.355 | 56.73 | – | -0.95 | -1.91 | -54.6 |
| Zhong et al. | 2020 | -0.666 | 56.726 | – | -0.922 | -1.933 | -59.678 |
| Cantat-Gaudin & Anders | 2020 | -0.666 | 56.726 | 0.453 | -0.922 | -1.933 | – |
| Liu & Pang | 2019 | 359.329 | 56.728 | 0.449 | -0.924 | -1.93 | – |
| Soubiran et al. | 2018 | 359.334 | 56.726 | – | – | – | -54.15 |
| Bica et al. | 2019 | 359.341 | 56.723 | – | – | – | – |
| Cantat-Gaudin et al. | 2018 | -0.666 | 56.726 | 0.453 | -0.922 | -1.933 | – |
| Loktin & Popova | 2017 | 359.355 | 56.708 | – | 0.145 | -0.881 | -54.7 |
| Kharchenko et al. | 2016 | 359.347 | 56.726 | – | – | – | – |
| Dias et al. | 2014 | 359.35 | 56.708 | – | 2.86 | -0.74 | – |
| Kharchenko et al. | 2013 | 359.355 | 56.73 | – | 0.62 | -2.87 | -54.7 |
| Gozha et al. | 2012 | 359.35 | 56.708 | – | – | – | – |
| Kharchenko et al. | 2012 | 359.355 | 56.73 | – | 0.62 | -2.87 | -64.0 |
| Bukowiecki et al. | 2011 | 359.342 | 56.734 | – | – | – | – |
| Piskunov et al. | 2008 | 359.309 | 56.709 | – | – | – | – |
| Kharchenko et al. | 2007 | 359.35 | 56.71 | – | 0.27 | – | – |
| Piskunov et al. | 2007 | 359.309 | 56.709 | – | – | – | – |
| Ahumada & Lapasset | 2007 | 359.35 | 56.717 | – | – | – | – |
| van den Bergh | 2006 | 359.35 | 56.708 | – | – | – | – |
| Kharchenko et al. | 2005 | 359.31 | 56.71 | – | 3.03 | -0.58 | – |
| Kharchenko et al. | 2003 | 359.28 | 56.7 | – | 4.08 | 0.21 | – |
| Chen et al. | 2003 | 359.252 | 56.712 | – | – | – | – |
| Dias et al. | 2002 | 359.35 | 56.708 | – | 2.86 | -0.74 | -54.7 |
| Lynga | 1987 | 359.266 | 56.724 | – | – | – | – |
| Sulentic et al. | 1973 | 359.267 | 56.722 | – | – | – | – |
💡 Note: The UCC values are estimated from its identified members.
| Reference | Year | Dist [kpc] | Av [mag] | DAv [mag] | Age [Myr] | [Fe/H] [dex] | Mass [Msun] | Bfrac | BSS |
|---|---|---|---|---|---|---|---|---|---|
| UCC | 99999– | 2.07 | 0.78 | 0.26 | 1616 | -0.046 | 8356 | 0.24 | 16 |
| Bijavara Seshashayana et al. | 2025 | – | 0.83 | – | 1550 | -0.020(14) | – | – | – |
| Otto et al. | 2026 | – | – | – | 1549 | 0.030(15) | – | – | – |
| Li et al. | 2025 | 1.95 | 0.95 | – | 1709 | -0.046 | – | – | – |
| Guerco et al. | 2025 | – | – | – | 1550 | -0.030 | – | – | – |
| Hu & Soubiran | 2025 | – | – | – | – | -0.090(5) | – | – | – |
| Carrasco-Varela et al. | 2025 | 1.91 | 1.02 | – | 1614 | -0.100 | – | – | 16(1) |
| Zhang et al. | 2024 | – | – | – | – | -0.085(1) | – | – | – |
| Hunt & Reffert | 2024 | – | – | – | – | – | 17849(1) | – | – |
| Cavallo et al. | 2024 | 1.98 | 1.03 | – | 1349 | 0.160 | – | – | – |
| Rain et al. | 2024 | 1.91 | 1.08 | – | 1590 | – | 22150 | 0.24 | – |
| Hunt & Reffert | 2023 | 1.96 | 0.78 | 0.26 | 1567 | – | – | – | – |
| Angelo et al. | 2023 | 1.86 | 0.95 | – | 1585 | 0.000 | 31(1) | – | – |
| Just et al. | 2023 | – | – | – | 1841 | – | 1854 | – | – |
| Spina et al. | 2022 | – | – | – | – | -0.010 | – | – | – |
| Jadhav & Subramaniam | 2021 | 2.10 | 0.83 | – | 1549 | – | 22265 | – | 16(1) |
| Jaehnig et al. | 2021 | 2.06(1) | – | – | – | – | – | – | – |
| Rain et al. | 2021 | 2.07 | 1.86 | – | 3311 | – | – | – | 16 |
| Dias et al. | 2021 | 1.91 | 1.02 | – | 1618 | 0.026 | – | – | – |
| Spina et al. | 2021 | 2.23 | – | – | 1549 | -0.013(20) | – | – | – |
| Cantat-Gaudin et al. | 2020 | 2.10 | 0.83 | – | 1549 | – | – | – | – |
| Kounkel et al. | 2020 | 2.09 | 0.95 | – | 1445 | – | – | – | – |
| Donor et al. | 2020 | – | – | – | – | -0.010 | – | – | – |
| Zhong et al. | 2020 | 2.07(1) | 0.70 | – | 9265 | -0.059 | – | – | – |
| Cantat-Gaudin & Anders | 2020 | 2.07 | – | – | – | – | – | – | – |
| Liu & Pang | 2019 | – | – | – | 2290 | -0.500 | – | – | – |
| Soubiran et al. | 2018 | 2.07 | – | – | – | – | – | – | – |
| Cantat-Gaudin et al. | 2018 | 2.07 | – | – | – | – | – | – | – |
| Loktin & Popova | 2017 | 2.40 | 0.67 | – | 1671 | – | – | – | – |
| Kharchenko et al. | 2016 | 1.80 | 0.70 | – | 1841 | – | – | – | – |
| Kharchenko et al. | 2013 | 1.80 | 0.70 | – | 1841 | -0.240 | – | – | – |
| Bukowiecki et al. | 2012 | – | – | – | – | – | 10944 | – | – |
| Gozha et al. | 2012 | 1.79 | – | – | 1413 | -0.240 | 6166 | – | – |
| Kharchenko et al. | 2012 | 1.80 | 0.70 | – | 1841 | -0.240 | – | – | – |
| Bukowiecki et al. | 2011 | 1.95(1) | 0.66 | – | 1413 | – | – | – | – |
| Piskunov et al. | 2008 | 2.34 | 0.69 | – | 1698 | – | 8356(1) | – | – |
| Piskunov et al. | 2007 | 2.34 | 0.69 | – | 1698 | – | 2056 | – | – |
| Ahumada & Lapasset | 2007 | – | 0.69 | – | 1738 | – | – | – | 22 |
| van den Bergh | 2006 | 2.34 | 0.69 | – | 1738 | – | – | – | – |
| Kharchenko et al. | 2005 | 2.34 | 0.69 | – | 1698 | – | – | – | – |
| Kharchenko et al. | 2003 | 2.34 | 0.69 | – | – | – | – | – | – |
| Chen et al. | 2003 | 2.34 | 0.68 | – | 1710 | -0.080(1) | – | – | – |
| Dias et al. | 2002 | 1.79 | 0.88 | – | 1413 | 0.020 | – | – | – |
| Lynga | 1987 | 1.90 | 0.85 | – | 1585 | -0.100 | – | – | – |
(N): Indicates that there are N extra values assigned to this parameter in the corresponding reference.
Cavallo et al. (2024)
Gold sample.
Hunt & Reffert (2024)
Classified as open cluster. CMD class: 1.00 (50th percentile).
Rain et al. (2024)
The cluster shows evidence for a double BSS sequence, less pronounced than in Melotte 66. Both sequences are consistent with different binary evolution tracks. Independent studies confirm several BSSs as binaries, but CMD positions of binary and apparently single BSSs overlap without clear separation.
Rain et al. (2021)
The red limit of the straggler area is BP-RP=0.70. There are several stragglers candidates with a radius larger than the apparent radius of the cluster (r=25.0 arcmin (Dias et al., 2002A&A...389..871D, Cat. B/ocl). Apparently, star Gaia DR2 1994778907595519616 is a massive straggler.
Ahumada & Lapasset (2007)
The first selection was based on the photometric study (1958ApJ...128..174B), which is complete (it includes stars up to 7.5' from the cluster centre); the star designations are from (1923VeBon..18....1K). A further selection took into account the detailed membership analysis for each blue straggler (1982ApJ...263..199B), and the proper-motion study (1981A&AS...43..337M). The following membership probabilities are from (1981A&AS...43..337M): star 88, 98%; star 168, 77%; star 192, 52%; star 197, 46%; star 282, 97%; star 316, 98%; star 342, 96%; star 371, 98%; star 409, 53%; star 410, 78%; star 453, 98%; star 651, 98%; star 677, 53%; star 696, 98%; star 746, 98%; star 753, 95%; star 861, 88%; star 1047, 96%; star 1097, 70%; star 1211, 97%. Star 1211 seems to be on the magnitude limit that the mass transfer theory predicts, and star 677 is above that limit (1980PASP...92..514B). An extensive halo of blue stragglers was described in (1980PASP...92..682M), but these stars would belong to the field (1985AJ.....90.1247T): at most, the strag- glers have the same radial distribution that the cluster giants. In the photometric ubvy study of 28 blue stragglers (1985AJ.....90.1247T) there appears to be no peculiar stars among them, except star 1211 (sp. Ap); in general, the objects seem to have evolved from the ZAMS. A spectroscopic study of eight, confirmed stragglers (2001A&A...366..490S) shows deficiency of surface Mg and low projected rotational velocities. Star 753 is a Delta Scuti variable (star V10 in ref. 189). In (1965ZA.....61...97S) this cluster is given E(B-V)=0.31 and age= 1.6 Gyr.