NGC 6469
(Melotte 182; Collinder 353; MWSC 2735; OCL 21; ESO 589 18)
0.83
UTI
0.59
CN
1.0
Cdens
1.0
CC3
0.79
Clit
1.0
Cdup
Stellar density (N50/rad)
30.5 [N/pc2]
- CN 0.59 Moderately populated
- Cdens 1.0 Very dense
- CC3 1.0 Very high quality
- Clit 0.79 Well-studied
- Cdup 1.0 Unique
 MOCA
MOCA
Overview
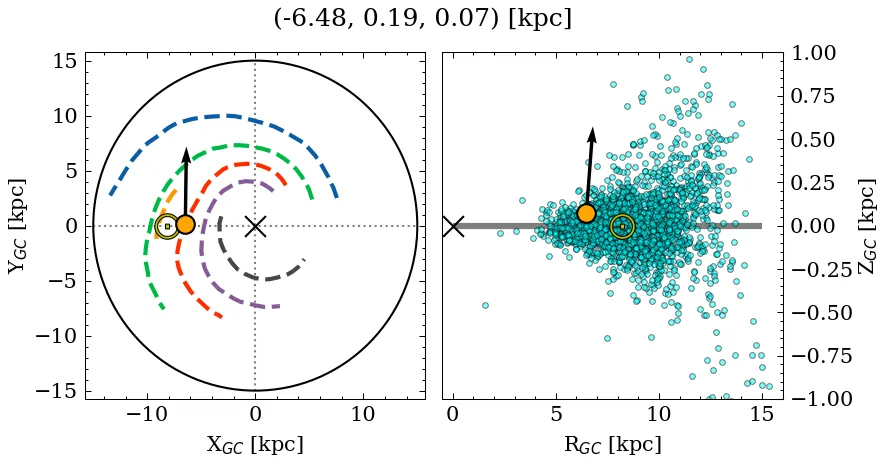
NGC 6469 is a moderately populated, very dense object of very high C3 quality. Its parallax locates it at a relatively close distance, above the mid-plane, affected by moderate extinction. It is catalogued as a near-solar metallicity, intermediate-age cluster, but with a large variance across recent sources for the age, metallicity, and mass parameters (see Parameters). It is well-studied in the literature.
Data
| Reference | Year | RA [deg] | DEC [deg] | Plx [mas] | pmRA [mas/yr] | pmDE [mas/yr] | Rv [km/s] |
|---|---|---|---|---|---|---|---|
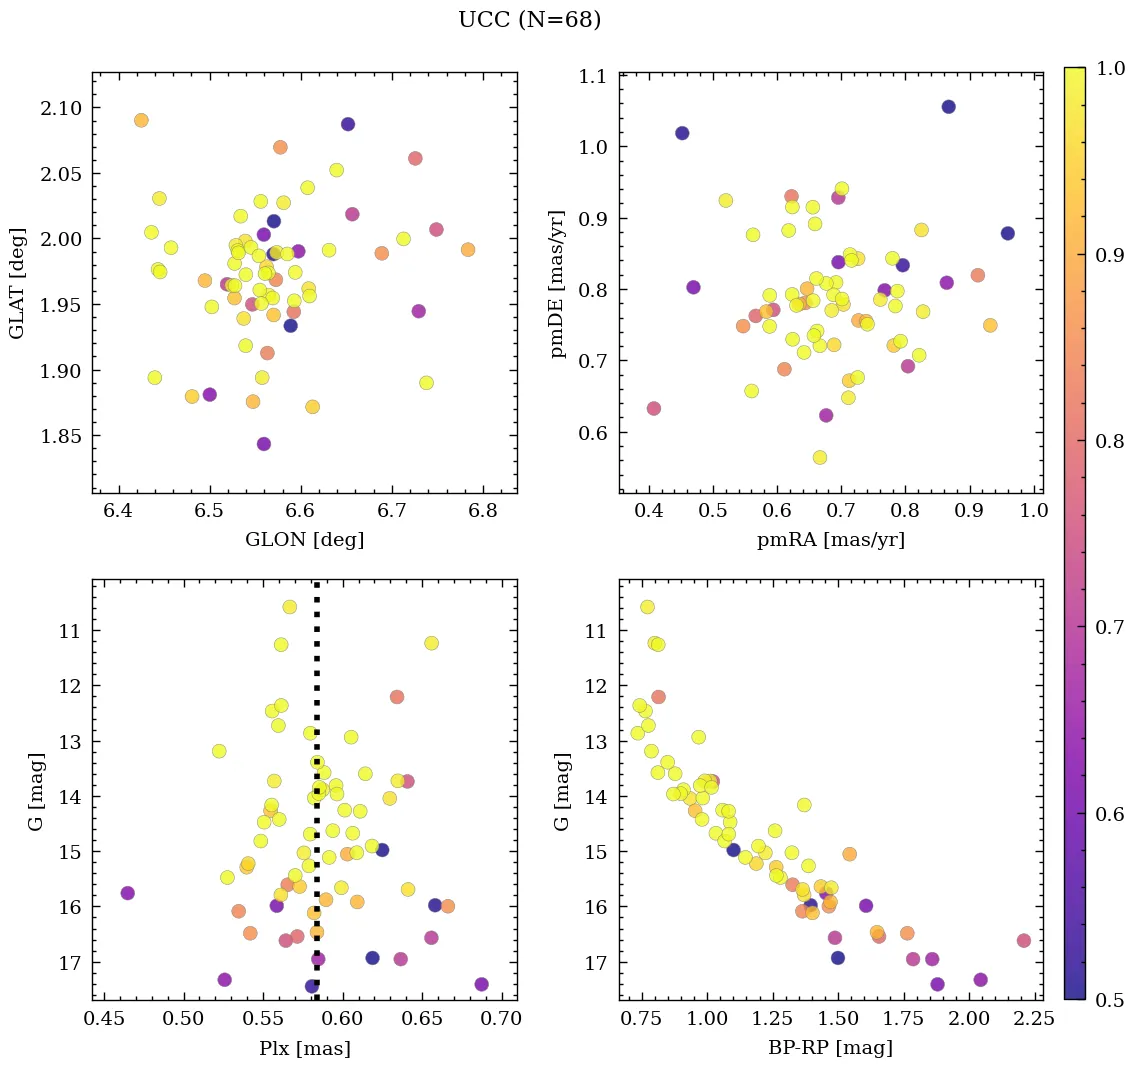
| UCC | 99999– | 268.271 | -22.298 | 0.584 | 0.687 | 0.782 | -8.464 |
| Li et al. | 2025 | 268.277 | -22.3 | 0.587 | 0.638 | 0.813 | – |
| Almeida et al. | 2025 | 268.278 | -22.295 | – | – | – | – |
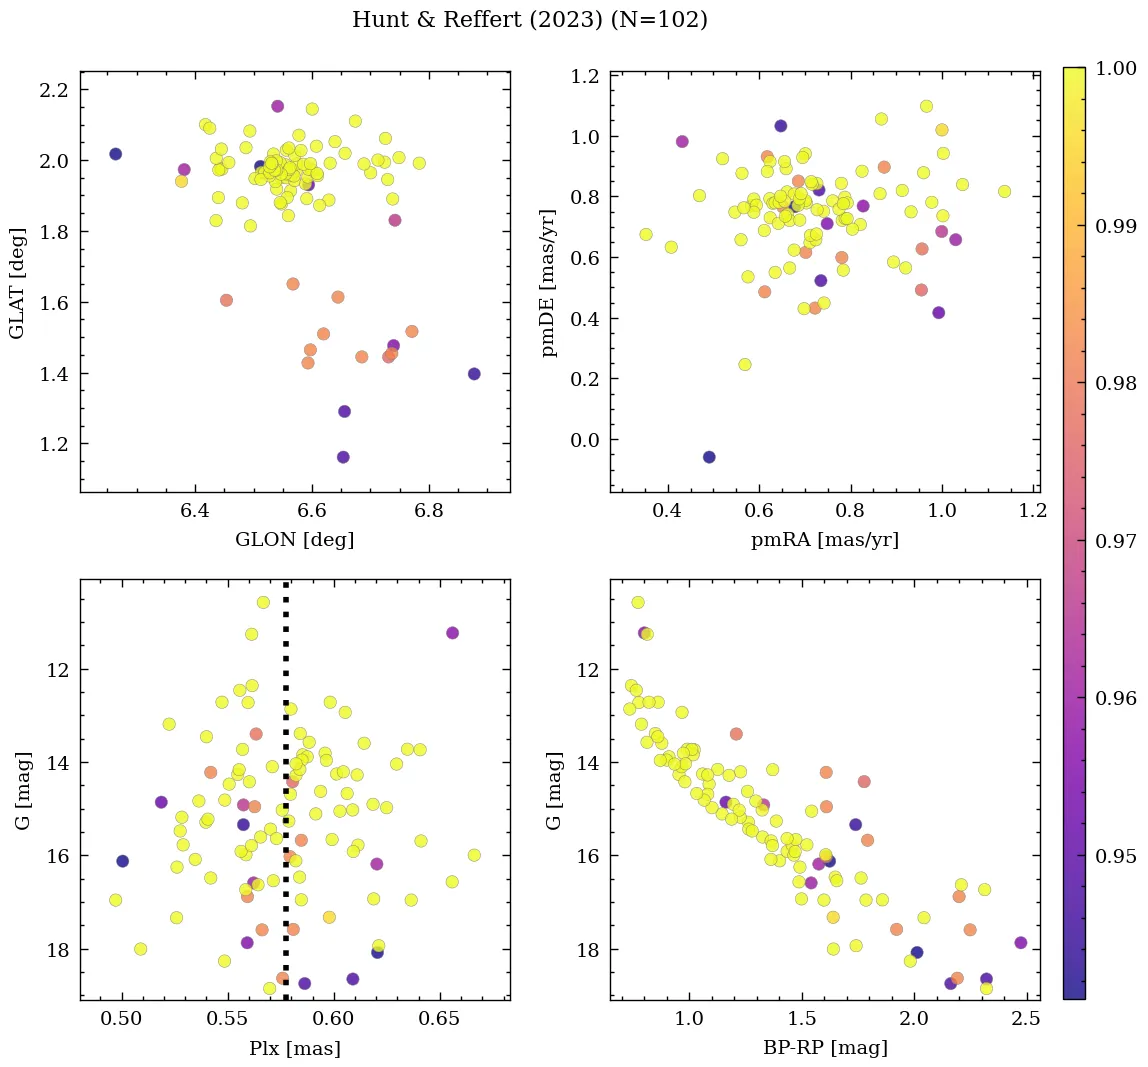
| Hunt & Reffert | 2024 | 268.268 | -22.305 | 0.578 | 0.722 | 0.747 | -1.914 |
| Cavallo et al. | 2024 | 268.271 | -22.293 | 0.579 | – | – | – |
| Hunt & Reffert | 2023 | 268.268 | -22.305 | 0.578 | 0.722 | 0.747 | -1.914 |
| Just et al. | 2023 | 268.297 | -22.316 | – | – | – | – |
| Dias et al. | 2021 | 268.278 | -22.295 | 0.598 | 0.634 | 0.814 | – |
| Spina et al. | 2021 | 268.277 | -22.298 | 0.591 | 0.661 | 0.811 | – |
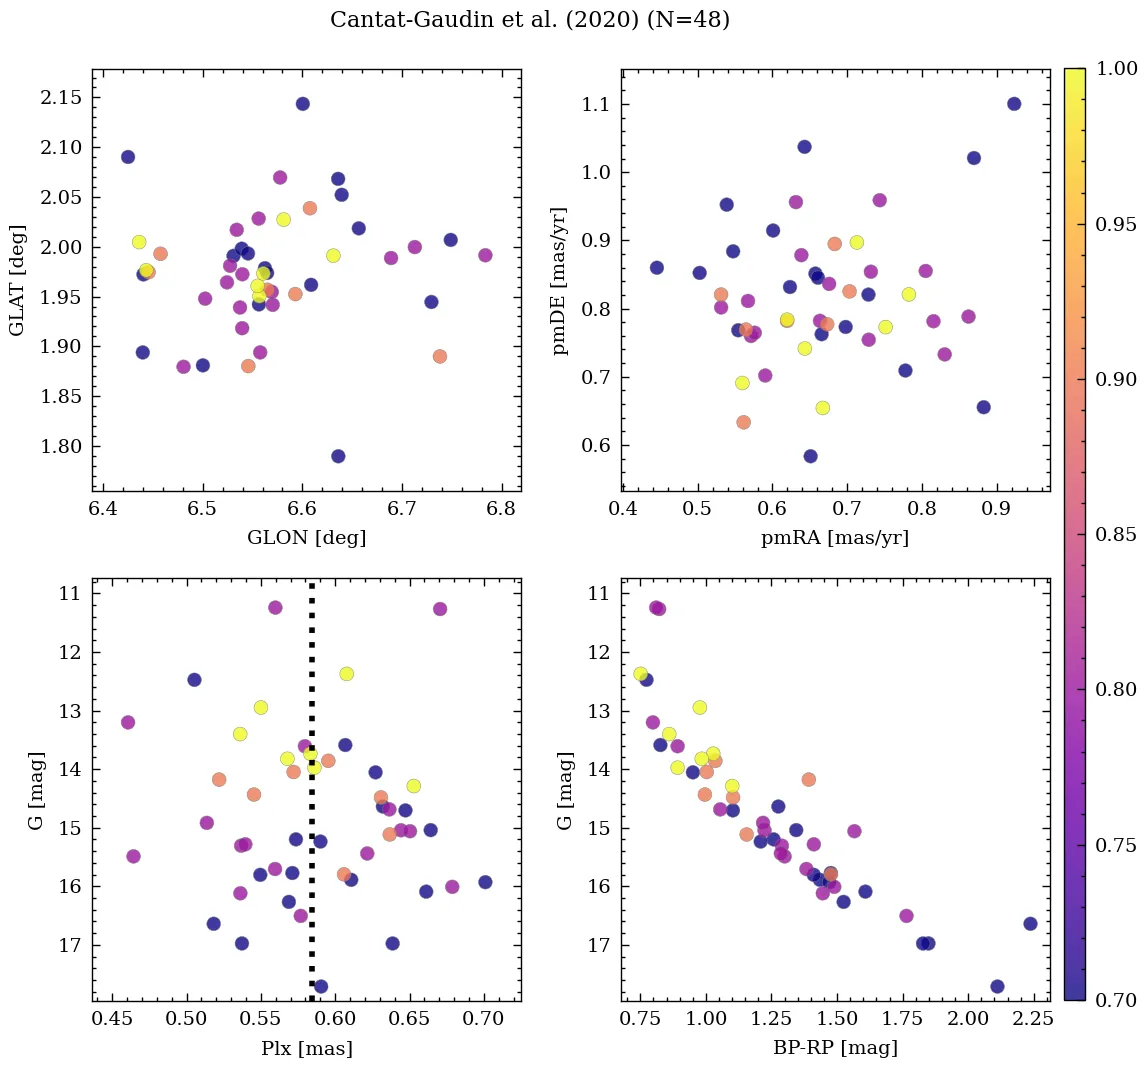
| Cantat-Gaudin et al. | 2020 | 268.277 | -22.3 | 0.587 | 0.638 | 0.813 | – |
| Cantat-Gaudin & Anders | 2020 | 268.277 | -22.3 | 0.587 | 0.638 | 0.813 | – |
| Bica et al. | 2019 | 268.31 | -22.318 | – | – | – | – |
| Cantat-Gaudin et al. | 2018 | 268.277 | -22.3 | 0.587 | 0.638 | 0.813 | – |
| Kharchenko et al. | 2016 | 268.297 | -22.316 | – | – | – | – |
| Dias et al. | 2014 | 268.3 | -22.275 | – | 0.53 | -2.86 | – |
| Kharchenko et al. | 2013 | 268.305 | -22.315 | – | 0.84 | -4.51 | – |
| Piskunov et al. | 2008 | 268.295 | -22.322 | – | – | – | – |
| Kharchenko et al. | 2005 | 268.3 | -22.32 | – | 3.04 | -1.2 | – |
| Kharchenko et al. | 2003 | 268.3 | -22.34 | – | 2.66 | -2.82 | – |
| Dias et al. | 2002 | 268.3 | -22.275 | – | 0.14 | -2.89 | – |
| Lynga | 1987 | 268.23 | -22.344 | – | – | – | – |
| Sulentic et al. | 1973 | 268.228 | -22.338 | – | – | – | – |
💡 Note: The UCC values are estimated from its identified members.
| Reference | Year | Dist [kpc] | Av [mag] | DAv [mag] | Age [Myr] | [Fe/H] [dex] | Mass [Msun] | Bfrac | BSS |
|---|---|---|---|---|---|---|---|---|---|
| UCC | 99999– | 1.6 | 1.83 | 2.03 | 160 | 0.059 | 259 | – | – |
| Li et al. | 2025 | 1.38 | 1.96 | – | 190 | 0.059 | – | – | – |
| Almeida et al. | 2025 | 1.60 | 2.06 | – | 88 | – | 259 | – | – |
| Hunt & Reffert | 2024 | – | – | – | – | – | 792(1) | – | – |
| Cavallo et al. | 2024 | 1.27 | 2.46 | – | 129 | -0.440 | – | – | – |
| Hunt & Reffert | 2023 | 1.61 | 2.23 | 2.03 | 28 | – | – | – | – |
| Just et al. | 2023 | – | – | – | 750 | – | 42 | – | – |
| Dias et al. | 2021 | 1.60 | 2.06 | – | 88 | 0.304 | – | – | – |
| Spina et al. | 2021 | 1.71 | – | – | 69 | – | – | – | – |
| Cantat-Gaudin et al. | 2020 | 1.71 | 1.62 | – | 69 | – | – | – | – |
| Kounkel et al. | 2020 | 1.77 | 2.32 | – | 123 | – | – | – | – |
| Cantat-Gaudin & Anders | 2020 | 1.62 | – | – | – | – | – | – | – |
| Cantat-Gaudin et al. | 2018 | 1.62 | – | – | – | – | – | – | – |
| Kharchenko et al. | 2016 | 0.69 | 1.05 | – | 750 | – | – | – | – |
| Kharchenko et al. | 2013 | 0.69 | 1.05 | – | 750 | – | – | – | – |
| Piskunov et al. | 2008 | 0.55 | 0.95 | – | 229 | – | – | – | – |
| Kharchenko et al. | 2005 | 0.55 | 0.95 | – | 229 | – | – | – | – |
| Kharchenko et al. | 2003 | 0.62 | 0.95 | – | – | – | – | – | – |
| Dias et al. | 2002 | 1.10 | 1.83 | – | 251 | – | – | – | – |
| Lynga | 1987 | 1.60 | – | – | – | – | – | – | – |
(N): Indicates that there are N extra values assigned to this parameter in the corresponding reference.
Palma et al. (2025)
Classified as optical pair P414, along with HSC_110.
Almeida et al. (2025)
Mass determination: intermediate fit. Isochrone match: intermediate fit. Silver sample.
Cavallo et al. (2024)
Gold sample.
Hunt & Reffert (2024)
Classified as open cluster. CMD class: 0.86 (50th percentile).