NGC 5999
(Melotte 137; Collinder 293; VDBH 178; MWSC 2326; OCL 946; vdBergh-Hagen 178; ESO 178 01; FSR 1706)
0.96
UTI
0.9
CN
1.0
Cdens
1.0
CC3
0.95
Clit
1.0
Cdup
Nm (P>50%)
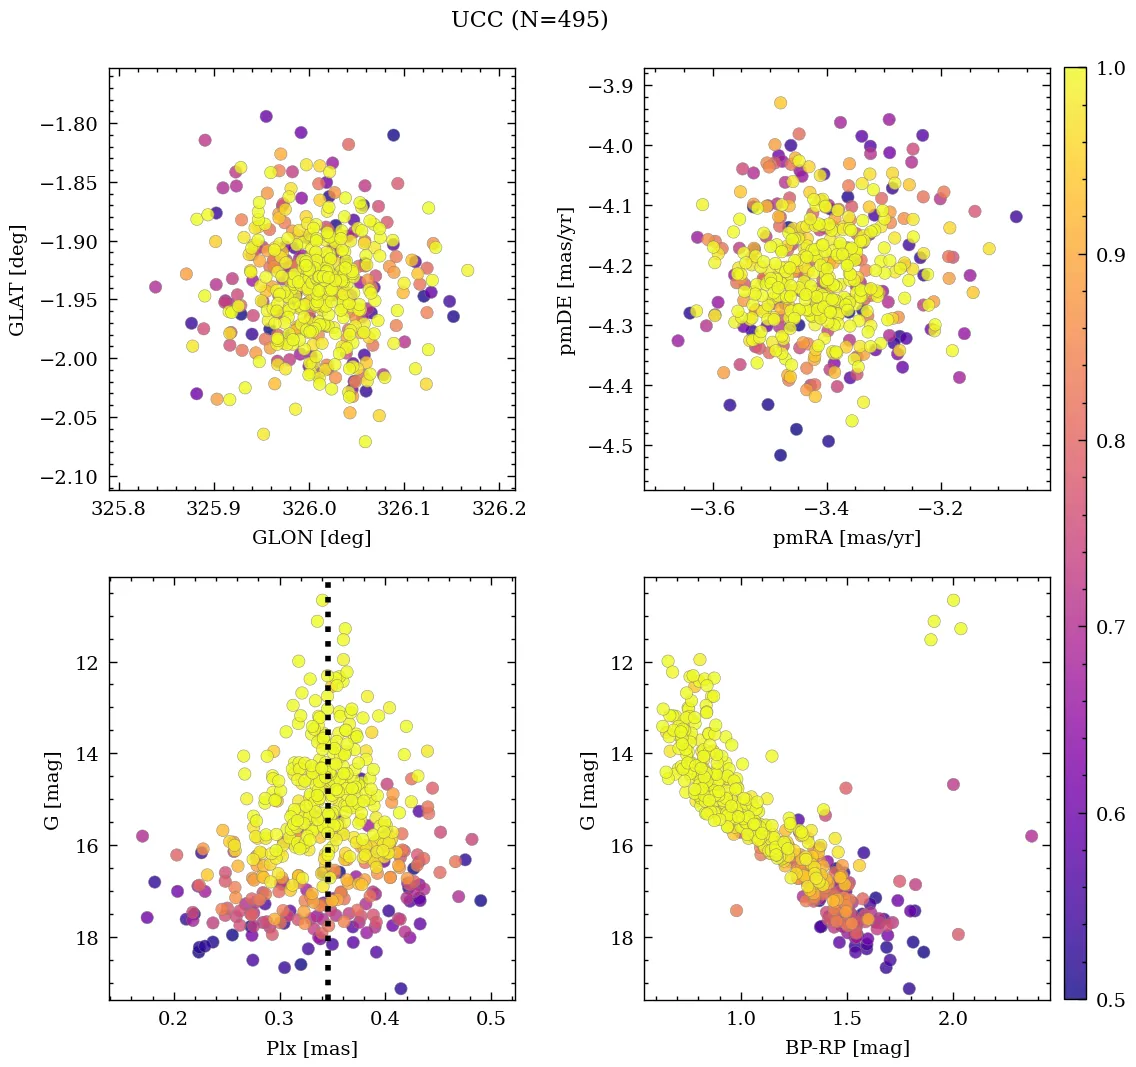
495
Core radius and density
1.0 [pc], 21 [pc-2]
- CN 0.9 Very rich
- Cdens 1.0 Very dense
- CC3 1.0 Very high quality
- Clit 0.95 Very well-studied
- Cdup 1.0 Unique
 MOCA
MOCA
Overview
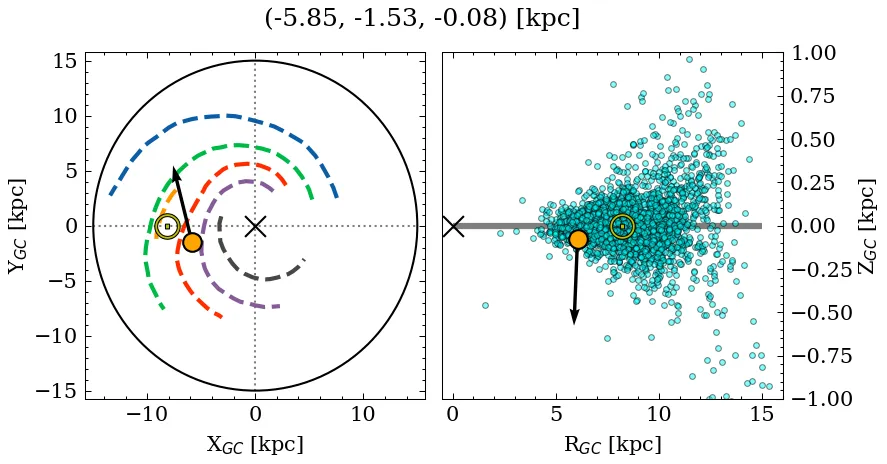
NGC 5999 is a very rich, very dense object of very high C3 quality. Its parallax locates it at a moderate distance, below the mid-plane, affected by moderate extinction. It is catalogued as a massive, near-solar metallicity, intermediate-age cluster, but with a large variance across recent sources for the distance, age, and mass parameters (see Parameters). It is very well-studied in the literature.
Note: This object contains blue stragglers according to at least one source.
Data
| Reference | Year | RA [deg] | DEC [deg] | Plx [mas] | pmRA [mas/yr] | pmDE [mas/yr] | Rv [km/s] |
|---|---|---|---|---|---|---|---|
| UCC | 99999– | 238.045 | -56.483 | 0.345 | -3.411 | -4.22 | -31.119 |
| Li et al. | 2026 | 238.06 | -56.48 | – | – | – | – |
| Schweers & McSwain | 2026 | 238.05 | -56.48 | – | – | – | – |
| Li et al. | 2025 | 238.046 | -56.482 | 0.326 | -3.389 | -4.216 | – |
| Almeida et al. | 2025 | 238.047 | -56.482 | – | – | – | – |
| Hunt & Reffert | 2024 | 238.044 | -56.479 | 0.349 | -3.421 | -4.211 | -33.152 |
| Cavallo et al. | 2024 | 238.049 | -56.486 | 0.348 | – | – | – |
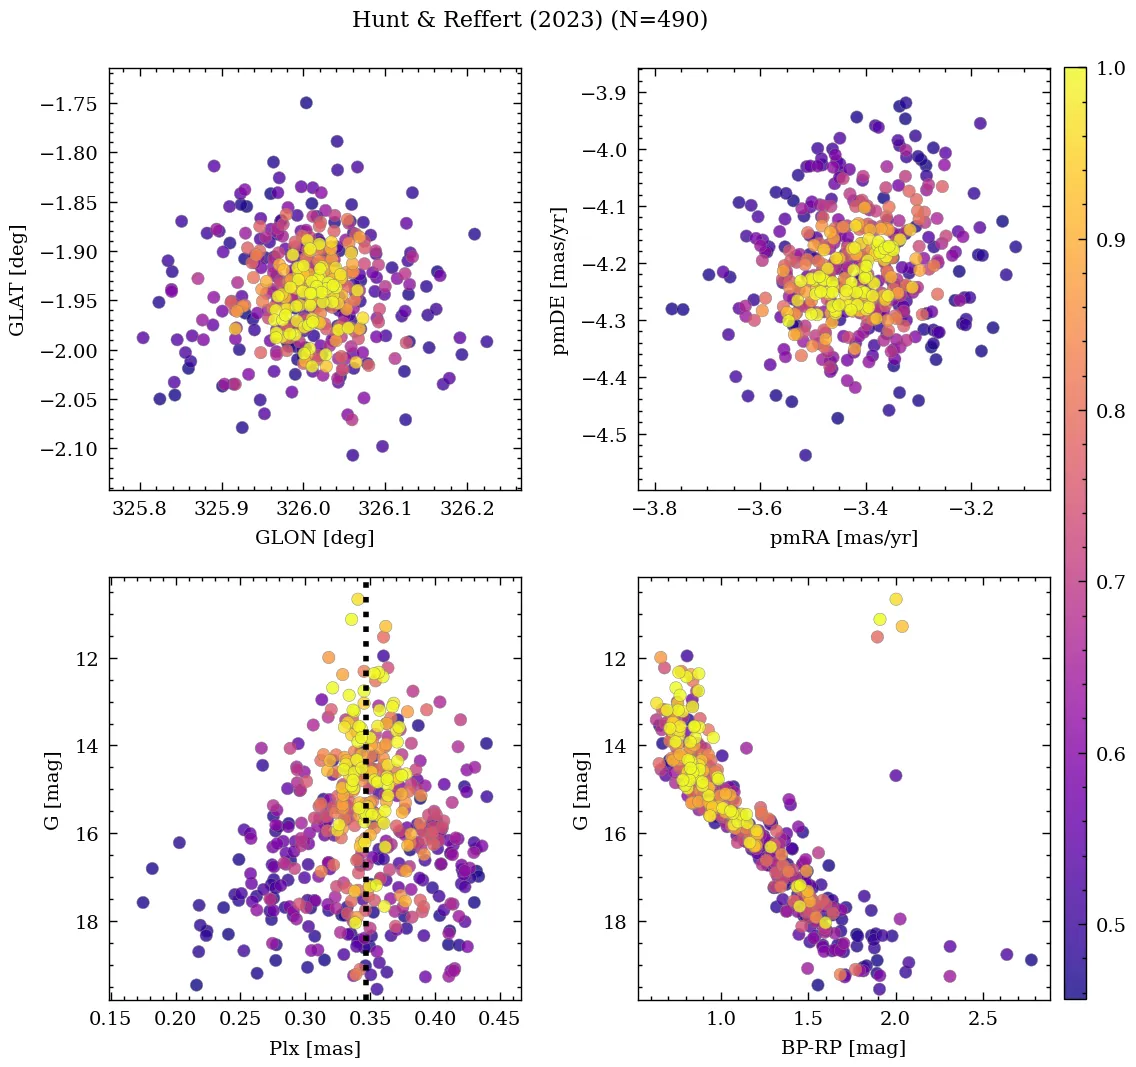
| Hunt & Reffert | 2023 | 238.044 | -56.479 | 0.349 | -3.421 | -4.211 | -33.152 |
| Almeida et al. | 2023 | 238.048 | -56.484 | – | – | – | – |
| Just et al. | 2023 | 238.031 | -56.466 | – | – | – | – |
| Jaehnig et al. | 2021 | 238.054 | -56.481 | 0.36 | -3.372 | -4.226 | – |
| Rain et al. | 2021 | 238.046 | -56.482 | 0.326 | -3.389 | -4.216 | – |
| Dias et al. | 2021 | 238.047 | -56.482 | 0.329 | -3.389 | -4.21 | -30.883 |
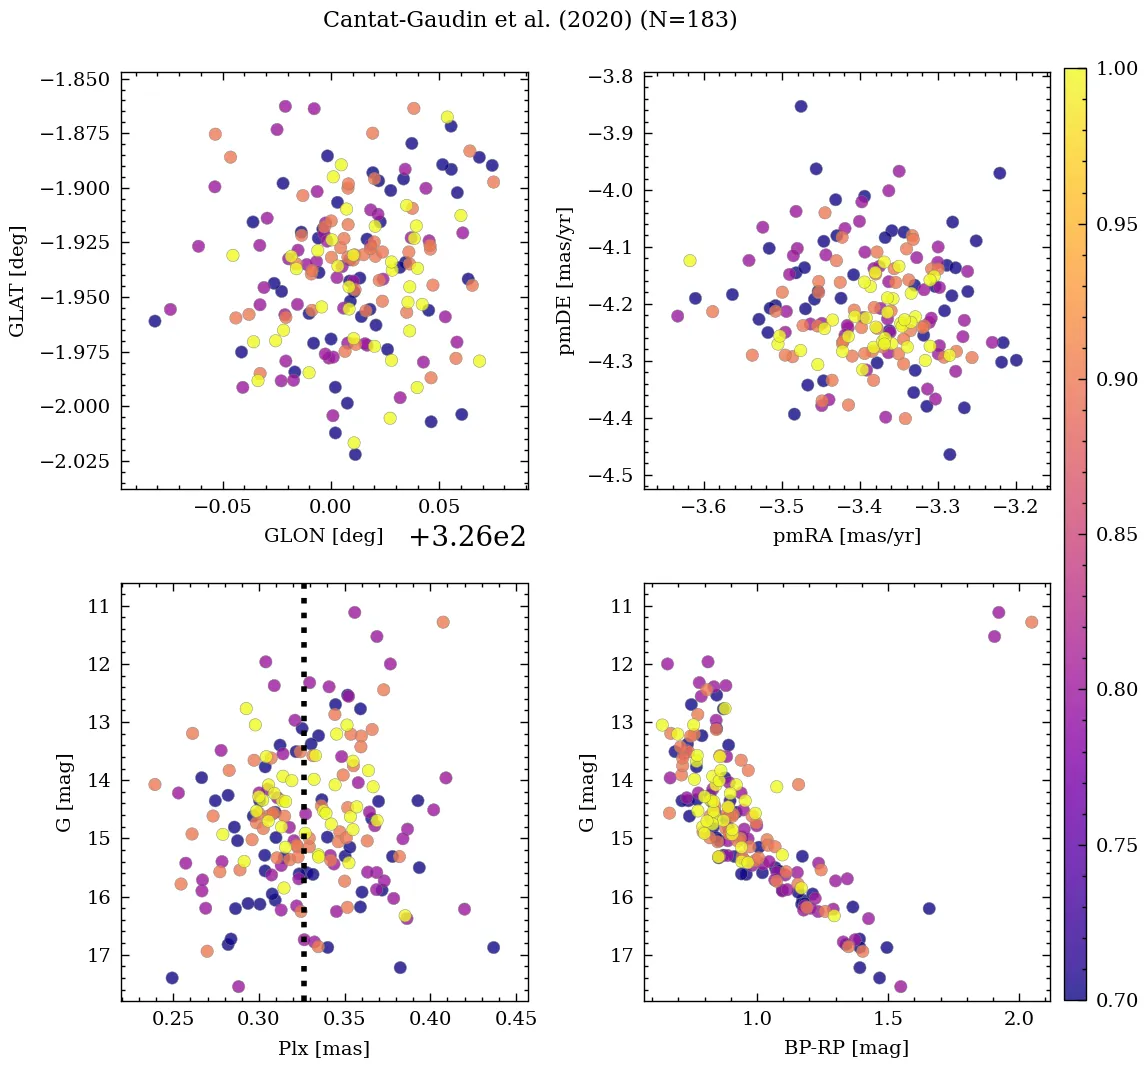
| Cantat-Gaudin et al. | 2020 | 238.046 | -56.482 | 0.326 | -3.389 | -4.216 | – |
| Cantat-Gaudin & Anders | 2020 | 238.046 | -56.482 | 0.326 | -3.389 | -4.216 | – |
| Soubiran et al. | 2018 | 238.046 | -56.482 | – | – | – | -30.78 |
| Bica et al. | 2019 | 238.03 | -56.468 | – | – | – | – |
| Ferreira et al. | 2019 | 238.047 | -56.488 | – | -3.374 | -4.216 | – |
| Cantat-Gaudin et al. | 2018 | 238.046 | -56.482 | 0.326 | -3.389 | -4.216 | – |
| Dias et al. | 2018 | – | – | – | -3.15 | -4.08 | – |
| Dib et al. | 2018 | 238.042 | -56.467 | – | – | – | – |
| Sampedro et al. | 2017 | 238.033 | -56.473 | – | -1.47 | -3.25 | – |
| Joshi et al. | 2016 | 238.042 | -56.467 | – | – | – | – |
| Dias et al. | 2016 | 238.033 | -56.473 | – | -0.72 | -2.74 | – |
| Kharchenko et al. | 2016 | 238.031 | -56.466 | – | – | – | – |
| Netopil et al. | 2016 | 238.043 | -56.467 | – | – | – | – |
| Dias et al. | 2014 | 238.033 | -56.473 | – | -0.72 | -2.79 | – |
| Kharchenko et al. | 2013 | 238.042 | -56.467 | – | 0.8 | 0.25 | – |
| Ahumada & Lapasset | 2007 | 238.05 | -56.483 | – | – | – | – |
| van den Bergh | 2006 | 238.05 | -56.467 | – | – | – | – |
| Dias et al. | 2002 | 238.033 | -56.473 | – | – | – | – |
| Lynga | 1987 | 238.056 | -56.47 | – | – | – | – |
| van den Bergh & Hagen | 1975 | 237.05 | -56.317 | – | – | – | – |
| Sulentic et al. | 1973 | 238.048 | -56.491 | – | – | – | – |
| Alter et al. | 1970 | 238.056 | -56.47 | – | – | – | – |
💡 Note: The UCC values are estimated from its identified members.
| Reference | Year | Dist [kpc] | Av [mag] | DAv [mag] | Age [Myr] | [Fe/H] [dex] | Mass [Msun] | Bfrac | BSS |
|---|---|---|---|---|---|---|---|---|---|
| UCC | 99999– | 2.355 | 1.545 | 1.39 | 372 | 0.070 | 1144 | 0.6 | 2 |
| Schweers & McSwain | 2026 | 38.01 | – | – | 100 | – | – | – | – |
| Li et al. | 2025 | 2.24 | 1.59 | – | 468 | 0.061 | – | – | – |
| Almeida et al. | 2025 | 2.19 | 1.87 | – | 196 | – | 1086 | – | – |
| Hunt & Reffert | 2024 | 2.56 | 1.79 | 1.39 | 137 | – | 4448(1) | – | – |
| Cavallo et al. | 2024 | 2.42 | 2.12 | – | 219 | 0.140 | – | – | – |
| Hunt & Reffert | 2023 | 2.56 | 1.78 | 1.39 | 137 | – | – | – | – |
| Almeida et al. | 2023 | 2.29 | 1.94 | – | 163 | 0.135 | 1203(1) | 0.60 | – |
| Just et al. | 2023 | – | – | – | 398 | – | 102 | – | – |
| Jaehnig et al. | 2021 | 2.80(1) | – | – | – | – | – | – | – |
| Rain et al. | 2021 | 2.81 | 1.42 | – | 398 | – | – | – | 0 |
| Dias et al. | 2021 | 2.19 | 1.87 | – | 196 | 0.079 | – | – | – |
| Cantat-Gaudin et al. | 2020 | 2.75 | 1.40 | – | 200 | – | – | – | – |
| Kounkel et al. | 2020 | 2.81 | 1.50 | – | 347 | – | – | – | – |
| Cantat-Gaudin & Anders | 2020 | 2.81 | – | – | – | – | – | – | – |
| Soubiran et al. | 2018 | 2.81 | – | – | – | – | – | – | – |
| Ferreira et al. | 2019 | 1.82 | 2.02 | – | 316 | -0.200 | – | – | – |
| Cantat-Gaudin et al. | 2018 | 2.81 | – | – | – | – | – | – | – |
| Dib et al. | 2018 | 1.63 | – | – | 398 | – | – | – | – |
| Joshi et al. | 2016 | 1.63 | 1.38 | – | 398 | – | – | – | – |
| Dias et al. | 2016 | 2.05 | 1.42 | – | 398 | 0.000 | – | – | – |
| Kharchenko et al. | 2016 | 1.63 | 1.38 | – | 398 | – | – | – | – |
| Netopil et al. | 2016 | 6.39 | – | – | 400 | – | – | – | – |
| Kharchenko et al. | 2013 | 1.63 | 1.38 | – | 398 | – | – | – | – |
| Ahumada & Lapasset | 2007 | – | 1.96 | – | 251 | – | – | – | 4 |
| van den Bergh | 2006 | 2.05 | 1.42 | – | 398 | – | – | – | – |
| Dias et al. | 2002 | 2.05 | 1.42 | – | 398 | – | – | – | – |
(N): Indicates that there are N extra values assigned to this parameter in the corresponding reference.
Li et al. (2026)
Tidal & Core radii: r_t=14+/-1.4 [pc], r_c=0.9+/-0.01 [pc]; stars within r_t: N~422
Almeida et al. (2025)
Mass determination: intermediate fit. Isochrone match: good fit. Silver sample.
Cavallo et al. (2024)
Gold sample.
Hunt & Reffert (2024)
Classified as open cluster. CMD class: 1.00 (50th percentile).
Hunt & Reffert (2023)
Classified as open cluster. CMD class: 1.00 (50th percentile).
Hu et al. (2021)
Ellipticities (core, all): e_core=0.0446, e_all=0.1144.
Ahumada & Lapasset (2007)
All the cluster parameters except the apparent diameter are from (2005, unpublished data). The diagram up to 2.5' from the cluster centre was examined.