NGC 3293
(VDBH 98; MWSC 1826; FoF 228)
0.98
UTI
0.9
CN
1.0
Cdens
1.0
CC3
1.0
Clit
1.0
Cdup
Nm (P>50%)
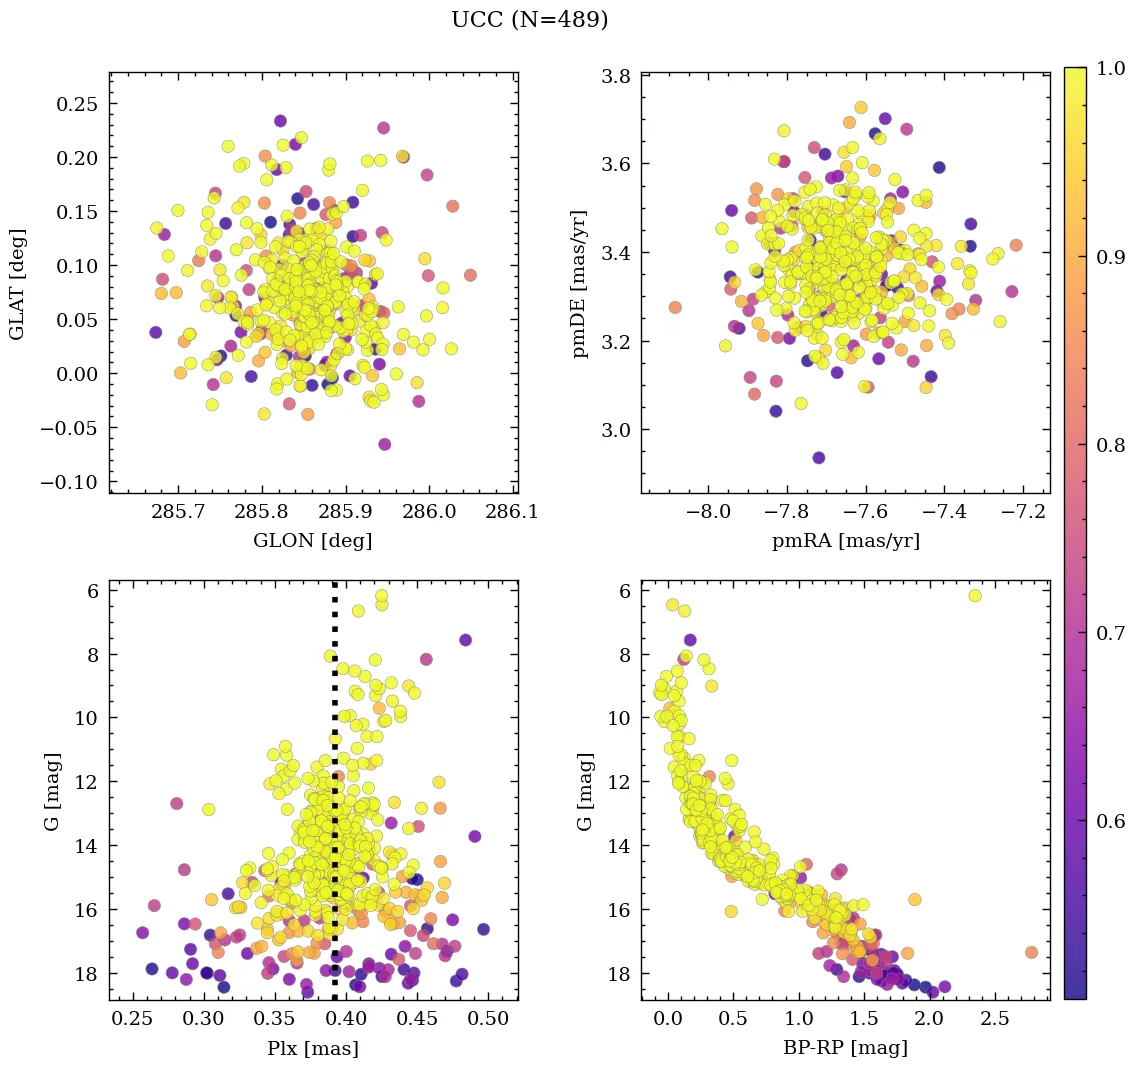
489
Core radius and density
1.2 [pc], 19 [pc-2]
- CN 0.9 Very rich
- Cdens 1.0 Very dense
- CC3 1.0 Very high quality
- Clit 1.0 Very well-studied
- Cdup 1.0 Unique
 MOCA
MOCA
Overview
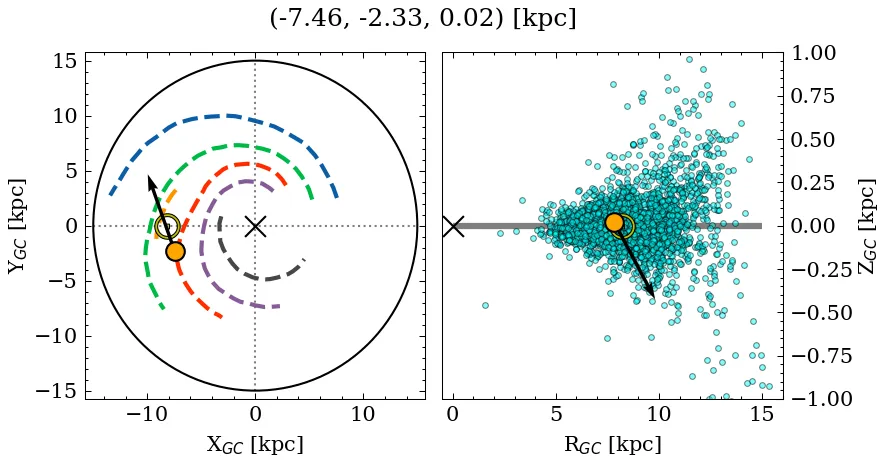
NGC 3293 is a very rich, very dense object of very high C3 quality. Its parallax locates it at a moderate distance, near the mid-plane, affected by low extinction. It is catalogued as a massive, near-solar metallicity, very young cluster, but with a large variance across recent sources for the mass parameter (see Parameters). It is very well-studied in the literature.
Data
| Reference | Year | RA [deg] | DEC [deg] | Plx [mas] | pmRA [mas/yr] | pmDE [mas/yr] | Rv [km/s] |
|---|---|---|---|---|---|---|---|
| UCC | 99999– | 158.967 | -58.233 | 0.392 | -7.664 | 3.362 | -13.169 |
| Li et al. | 2026 | 158.97 | -58.23 | – | – | – | – |
| Schweers & McSwain | 2026 | 158.97 | -58.23 | – | – | – | – |
| Li et al. | 2025 | 158.97 | -58.231 | 0.376 | -7.671 | 3.344 | – |
| Wei et al. | 2025 | 158.955 | -58.238 | 0.388 | -7.539 | 3.319 | – |
| Almeida et al. | 2025 | 158.966 | -58.228 | – | – | – | – |
| Hunt & Reffert | 2024 | 158.966 | -58.239 | 0.396 | -7.673 | 3.374 | -23.232 |
| Celli et al. | 2024 | 158.97 | -58.231 | – | – | – | – |
| Cavallo et al. | 2024 | 158.966 | -58.233 | 0.395 | – | – | – |
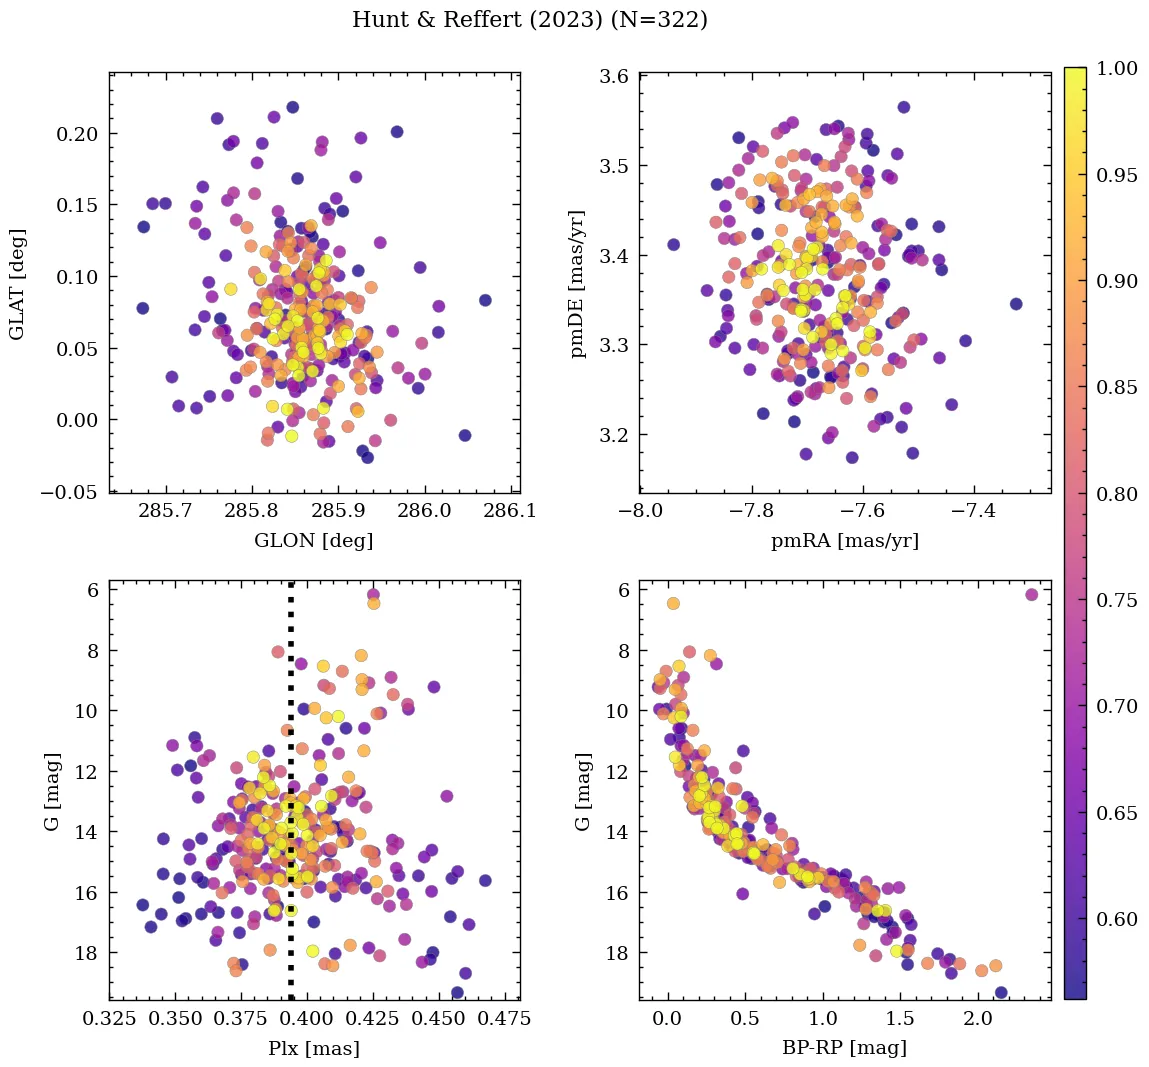
| Hunt & Reffert | 2023 | 158.966 | -58.239 | 0.396 | -7.673 | 3.374 | -23.232 |
| Almeida et al. | 2023 | 158.945 | -58.217 | – | – | – | – |
| Just et al. | 2023 | 158.948 | -58.227 | – | – | – | – |
| Jaehnig et al. | 2021 | 158.973 | -58.233 | 0.413 | -7.684 | 3.351 | – |
| Rain et al. | 2021 | 158.97 | -58.231 | 0.376 | -7.671 | 3.344 | – |
| Dias et al. | 2021 | 158.966 | -58.228 | 0.375 | -7.672 | 3.339 | – |
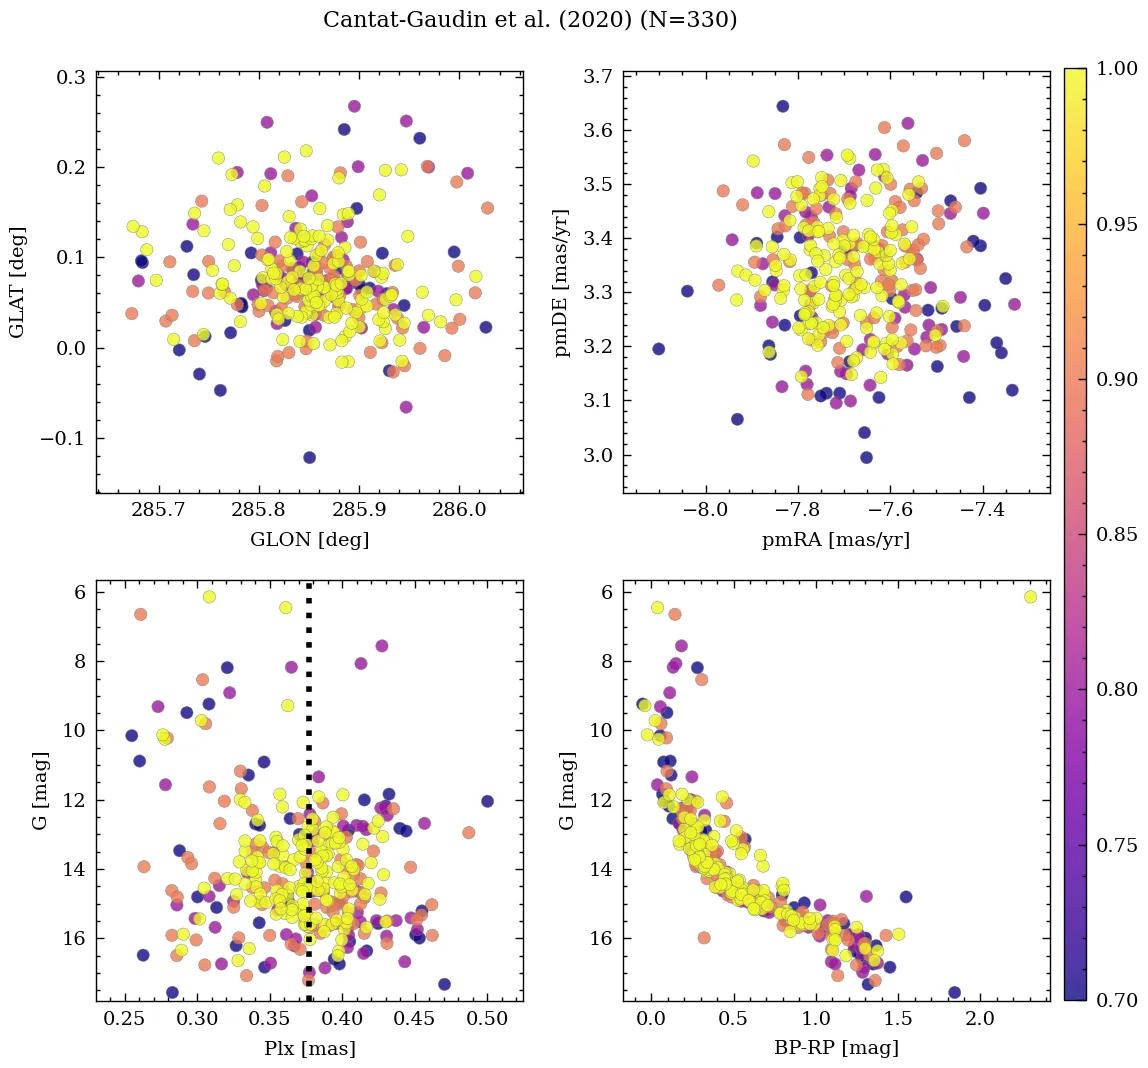
| Cantat-Gaudin et al. | 2020 | 158.97 | -58.231 | 0.376 | -7.671 | 3.344 | – |
| Sánchez et al. | 2020 | 158.963 | -58.23 | – | -7.634 | 3.363 | – |
| Cantat-Gaudin & Anders | 2020 | 158.97 | -58.231 | 0.376 | -7.671 | 3.344 | – |
| Liu & Pang | 2019 | 158.947 | -58.22 | 0.381 | -7.534 | 3.317 | – |
| Dias et al. | 2019 | 158.963 | -58.23 | 0.379 | -7.671 | 3.35 | -13.16 |
| Soubiran et al. | 2018 | 158.97 | -58.231 | – | – | – | -13.16 |
| Cantat-Gaudin et al. | 2018 | 158.97 | -58.231 | 0.376 | -7.671 | 3.344 | – |
| Loktin & Popova | 2017 | 158.955 | -58.23 | – | -7.53 | 3.1 | -11.2 |
| Sampedro et al. | 2017 | 158.963 | -58.23 | – | -6.35 | -0.1 | – |
| Dias et al. | 2016 | 158.963 | -58.23 | – | -7.53 | 3.1 | -12.0 |
| Kharchenko et al. | 2016 | 158.948 | -58.227 | – | – | – | – |
| Dias et al. | 2014 | 158.962 | -58.23 | – | -6.91 | 0.26 | – |
| Kharchenko et al. | 2013 | 158.955 | -58.23 | – | -7.22 | 2.11 | -11.2 |
| Gozha et al. | 2012 | 158.963 | -58.23 | – | – | – | – |
| Kharchenko et al. | 2009 | 158.949 | -58.23 | – | – | – | – |
| Piskunov et al. | 2008 | 158.949 | -58.23 | – | – | – | – |
| Kharchenko et al. | 2007 | 158.95 | -58.23 | – | 0.08 | – | -12.29 |
| Ahumada & Lapasset | 2007 | 158.975 | -58.233 | – | – | – | – |
| van den Bergh | 2006 | 158.953 | -58.217 | – | – | – | – |
| Kharchenko et al. | 2005 | 158.95 | -58.23 | – | -7.64 | 3.08 | -12.29 |
| Kharchenko et al. | 2003 | 158.95 | -58.22 | – | -7.21 | 2.24 | – |
| Chen et al. | 2003 | 159.06 | -58.229 | – | -7.53 | 3.1 | -13.0 |
| Dias et al. | 2002 | 158.963 | -58.23 | – | -7.53 | 3.1 | -13.0 |
| Dambis | 1999 | 158.953 | -58.217 | – | – | – | – |
| Lynga | 1987 | 158.965 | -58.235 | – | – | – | -13.0 |
| van den Bergh & Hagen | 1975 | 158.475 | -57.967 | – | – | – | – |
| Sulentic et al. | 1973 | 158.965 | -58.23 | – | – | – | – |
| Alter et al. | 1970 | 158.965 | -58.235 | – | – | – | – |
💡 Note: The UCC values are estimated from its identified members.
| Reference | Year | Dist [kpc] | Av [mag] | DAv [mag] | Age [Myr] | [Fe/H] [dex] | Mass [Msun] | Bfrac | BSS |
|---|---|---|---|---|---|---|---|---|---|
| UCC | 99999– | 2.44 | 0.83 | 1.105 | 10 | 0.000 | 1689 | 0.51 | 0 |
| Liu et al. | 2025 | 3.53 | 0.34 | – | 13 | – | – | – | – |
| Schweers & McSwain | 2026 | 2.64 | – | – | 10 | – | – | – | – |
| Li et al. | 2025 | 2.50 | 0.85 | – | 13 | 0.141 | – | – | – |
| Wei et al. | 2025 | 2.55 | 0.95 | – | 15 | 0.000 | 6866 | 0.41 | – |
| Almeida et al. | 2025 | 2.33 | 1.01 | – | 14 | – | 1689 | – | – |
| Hunt & Reffert | 2024 | 2.41 | 0.75 | 1.11 | 15 | – | 1433(1) | – | – |
| Celli et al. | 2024 | – | – | – | 10 | – | 2052 | – | – |
| Cavallo et al. | 2024 | 2.49 | 0.97 | – | 14 | -0.080 | – | – | – |
| Hunt & Reffert | 2023 | 2.41 | 0.75 | 1.10 | 15 | – | – | – | – |
| Almeida et al. | 2023 | 2.28 | 0.95 | – | 14 | 0.017 | 1975(1) | 0.61 | – |
| Just et al. | 2023 | – | – | – | 6 | – | 234 | – | – |
| Jaehnig et al. | 2021 | 2.42(1) | – | – | – | – | – | – | – |
| Rain et al. | 2021 | 2.47 | 0.82 | – | 10 | – | – | – | 0 |
| Dias et al. | 2021 | 2.33 | 1.01 | – | 14 | 0.028 | – | – | – |
| Cantat-Gaudin et al. | 2020 | 2.72 | 0.90 | – | 10 | – | – | – | – |
| Kounkel et al. | 2020 | 2.20 | 0.86 | – | 17 | – | – | – | – |
| Cantat-Gaudin & Anders | 2020 | 2.47 | – | – | – | – | – | – | – |
| Liu & Pang | 2019 | – | – | – | 15 | 0.000 | – | – | – |
| Dias et al. | 2019 | 1.77 | 0.85 | – | 14 | -0.881 | – | – | – |
| Soubiran et al. | 2018 | 2.47 | – | – | – | – | – | – | – |
| Cantat-Gaudin et al. | 2018 | 2.47 | – | – | – | – | – | – | – |
| Loktin & Popova | 2017 | 2.47 | 0.79 | – | 9 | – | – | – | – |
| Dias et al. | 2016 | 2.33 | 0.83 | – | 10 | – | – | – | – |
| Kharchenko et al. | 2016 | 2.44 | 1.05 | – | 6 | – | – | – | – |
| Kharchenko et al. | 2013 | 2.44 | 1.05 | – | 6 | – | – | – | – |
| Gozha et al. | 2012 | 2.33 | – | – | 10 | – | 191 | – | – |
| Kharchenko et al. | 2009 | 2.47 | 0.79 | – | 9 | – | – | – | – |
| Piskunov et al. | 2008 | 2.47 | 0.79 | – | 9 | – | – | – | – |
| Ahumada & Lapasset | 2007 | – | 0.82 | – | 10 | – | – | – | 1 |
| van den Bergh | 2006 | 2.33 | 0.82 | – | 10 | – | – | – | – |
| Kharchenko et al. | 2005 | 2.47 | 0.79 | – | 9 | – | – | – | – |
| Kharchenko et al. | 2003 | 2.33 | 0.79 | – | – | – | – | – | – |
| Chen et al. | 2003 | 2.33 | – | – | 10 | – | – | – | – |
| Dias et al. | 2002 | 2.33 | 0.83 | – | 10 | – | – | – | – |
| Dambis | 1999 | 2.16 | 0.80 | – | 10 | – | – | – | – |
| Lynga | 1987 | 2.60 | 0.91 | – | 25 | – | – | – | – |
| Alter et al. | 1970 | 2.60 | – | – | – | – | – | – | – |
(N): Indicates that there are N extra values assigned to this parameter in the corresponding reference.
Li et al. (2026)
Tidal & Core radii: r_t=22+/-4.2 [pc], r_c=0.68+/-0.0 [pc]; stars within r_t: N~579
Liu et al. (2025)
Classified as primordial binary cluster 287 along with UBC_258.
Palma et al. (2025)
Classified as optical pair P549, along with UBC_258.
Almeida et al. (2025)
Mass determination: good fit. Isochrone match: good fit. Gold sample.
Cavallo et al. (2024)
Gold sample.
Hunt & Reffert (2024)
Classified as open cluster. CMD class: 1.00 (50th percentile).
Hunt & Reffert (2023)
Classified as open cluster. CMD class: 1.00 (50th percentile).
Hu et al. (2021)
Ellipticities (core, all): e_core=0.0838, e_all=0.0256.
Ahumada & Lapasset (2007)
The dereddened colour-magnitude diagram in (1980AJ.....85.1193T) was examined. The adopted apparent diameter is from (1980AJ.....85.1193T), and the adopted centre is star 31. Star 1=HD 91824 (O7V(f)) is a probable member of the Car OB1 association (1980AJ.....85.1193T).