NGC 3114
(Melotte 98; Collinder 215; VDBH 86; MWSC 1749; OCL 802; vdBergh-Hagen 86; ESO 127 02; FoF 2058)
1.0
UTI
1.0
CN
1.0
Cdens
1.0
CC3
1.0
Clit
1.0
Cdup
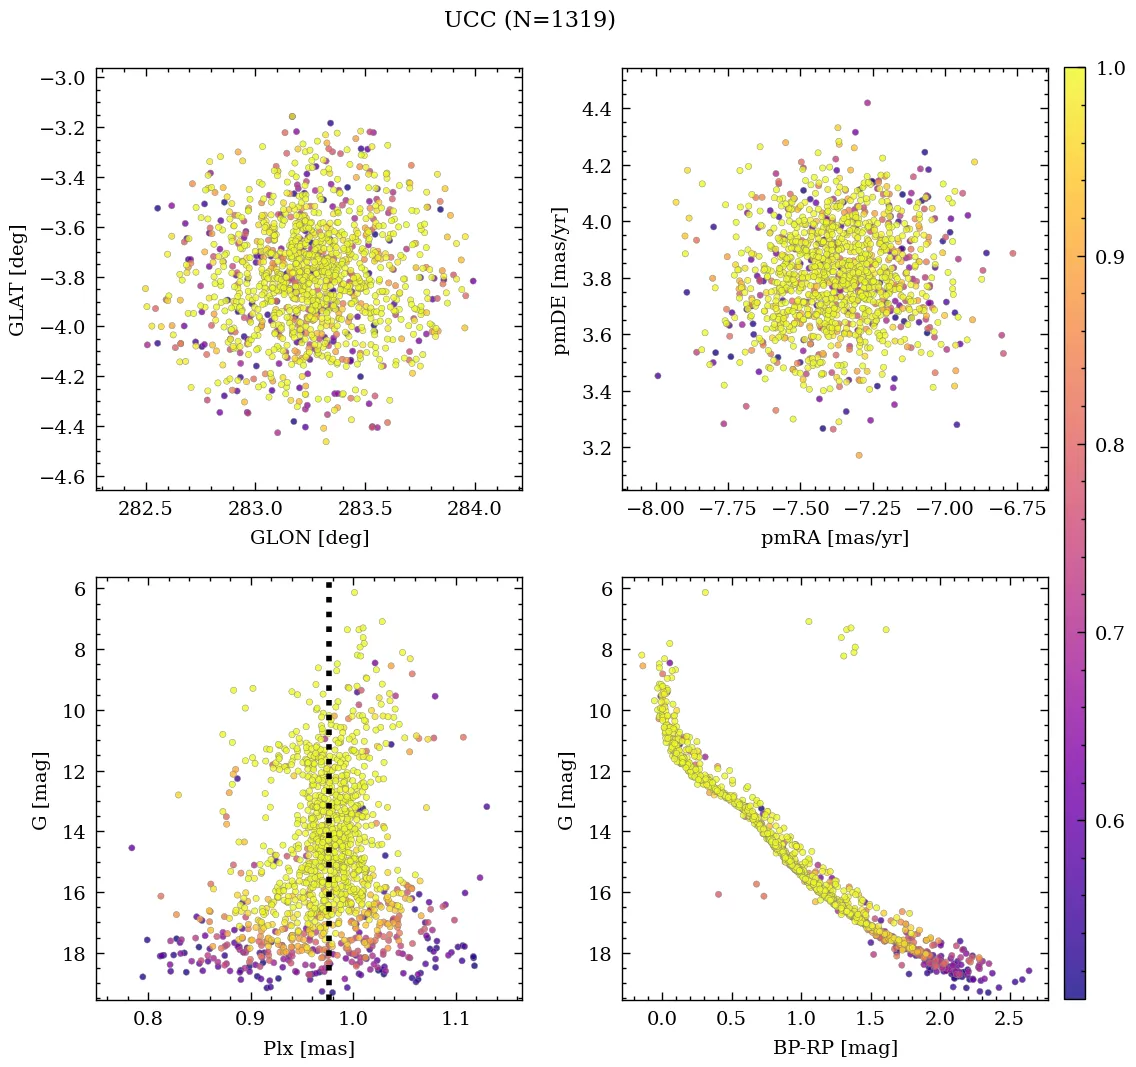
Nm (P>50%)
1319
Core radius and density
2.9 [pc], 11 [pc-2]
- CN 1.0 Very rich
- Cdens 1.0 Very dense
- CC3 1.0 Very high quality
- Clit 1.0 Very well-studied
- Cdup 1.0 Unique
 MOCA
MOCA
Overview
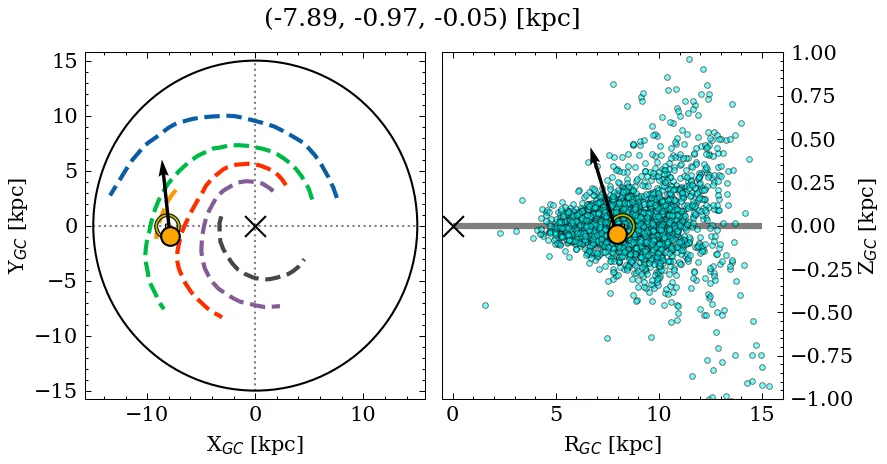
NGC 3114 is a very rich, very dense object of very high C3 quality. Its parallax locates it at a relatively close distance, near the mid-plane, affected by low extinction. It is catalogued as a massive, near-solar metallicity, intermediate-age cluster, but with a large variance across recent sources for the metallicity and mass parameters (see Parameters). It is very well-studied in the literature.
Data
| Reference | Year | RA [deg] | DEC [deg] | Plx [mas] | pmRA [mas/yr] | pmDE [mas/yr] | Rv [km/s] |
|---|---|---|---|---|---|---|---|
| UCC | 99999– | 150.56 | -60.039 | 0.976 | -7.371 | 3.803 | -2.949 |
| Malhotra et al. | 2026 | 150.479 | -60.038 | – | – | – | – |
| Li et al. | 2025 | 150.553 | -60.041 | 0.954 | -7.376 | 3.779 | – |
| Wei et al. | 2025 | 150.529 | -60.04 | 0.979 | -7.377 | 3.815 | – |
| Almeida et al. | 2025 | 150.572 | -60.056 | – | – | – | – |
| Hunt & Reffert | 2024 | 150.566 | -60.007 | 0.978 | -7.365 | 3.823 | -3.729 |
| Cavallo et al. | 2024 | 150.586 | -60.045 | 0.979 | – | – | – |
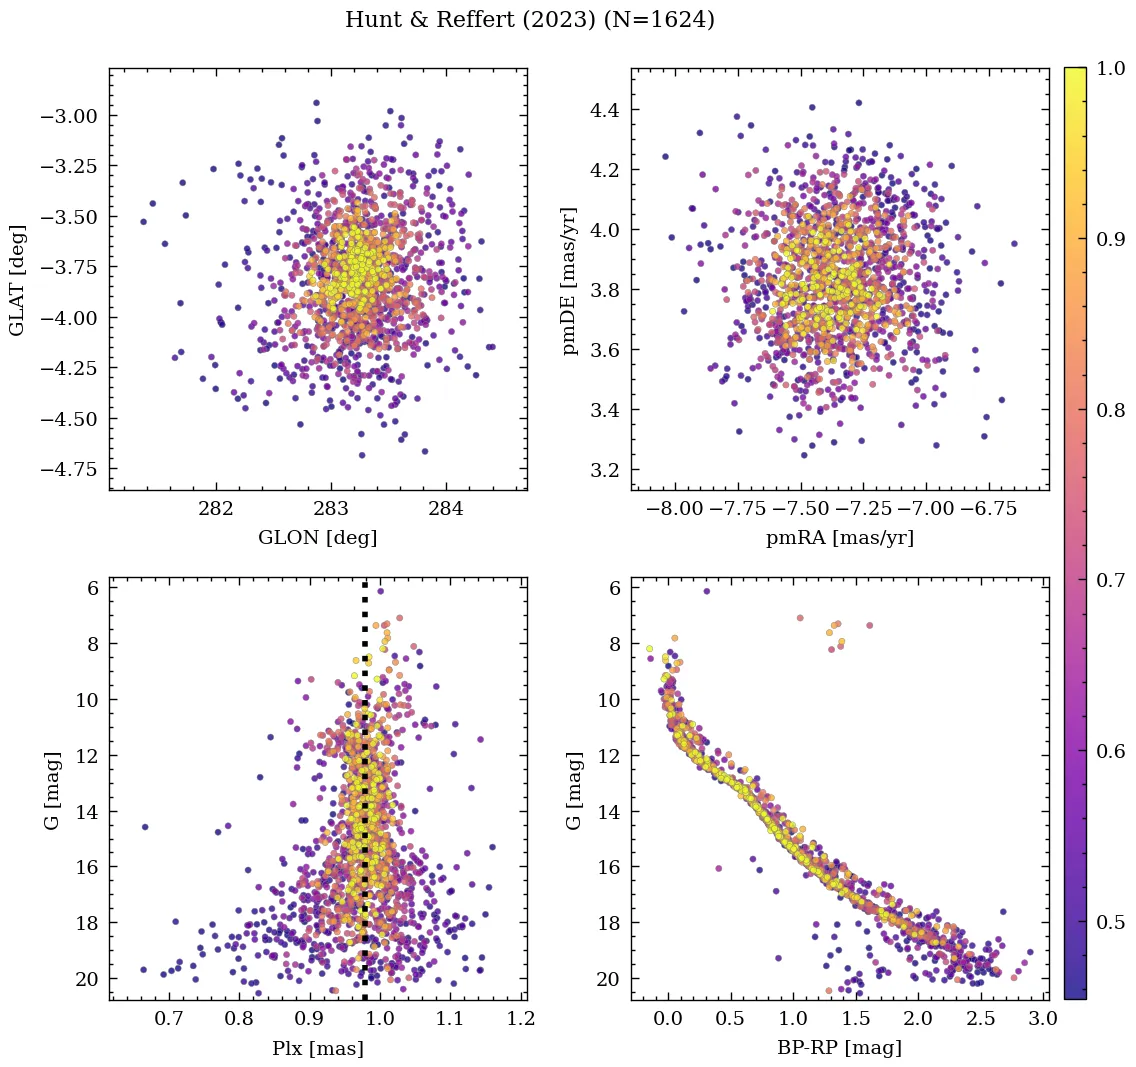
| Hunt & Reffert | 2023 | 150.566 | -60.007 | 0.978 | -7.365 | 3.823 | -3.729 |
| Angelo et al. | 2023 | 150.5 | -60.033 | – | -7.37 | 3.82 | – |
| Cordoni et al. | 2023 | 150.572 | -60.056 | 0.951 | -7.364 | 3.776 | – |
| Just et al. | 2023 | 150.474 | -60.106 | – | – | – | – |
| He et al. | 2022 | 150.561 | -60.05 | 0.981 | -7.374 | 3.808 | – |
| Tarricq et al. | 2022 | 150.486 | -60.018 | 0.971 | -7.338 | 3.843 | – |
| Jaehnig et al. | 2021 | 150.532 | -60.038 | 0.983 | -7.365 | 3.784 | – |
| Netopil et al. | 2022 | 150.65 | -60.121 | – | – | – | -1.02 |
| Rain et al. | 2021 | 150.553 | -60.041 | 0.954 | -7.376 | 3.779 | – |
| Richer et al. | 2021 | 150.577 | -60.046 | 0.948 | -7.332 | 3.789 | – |
| Dias et al. | 2021 | 150.572 | -60.056 | 0.951 | -7.364 | 3.776 | -1.093 |
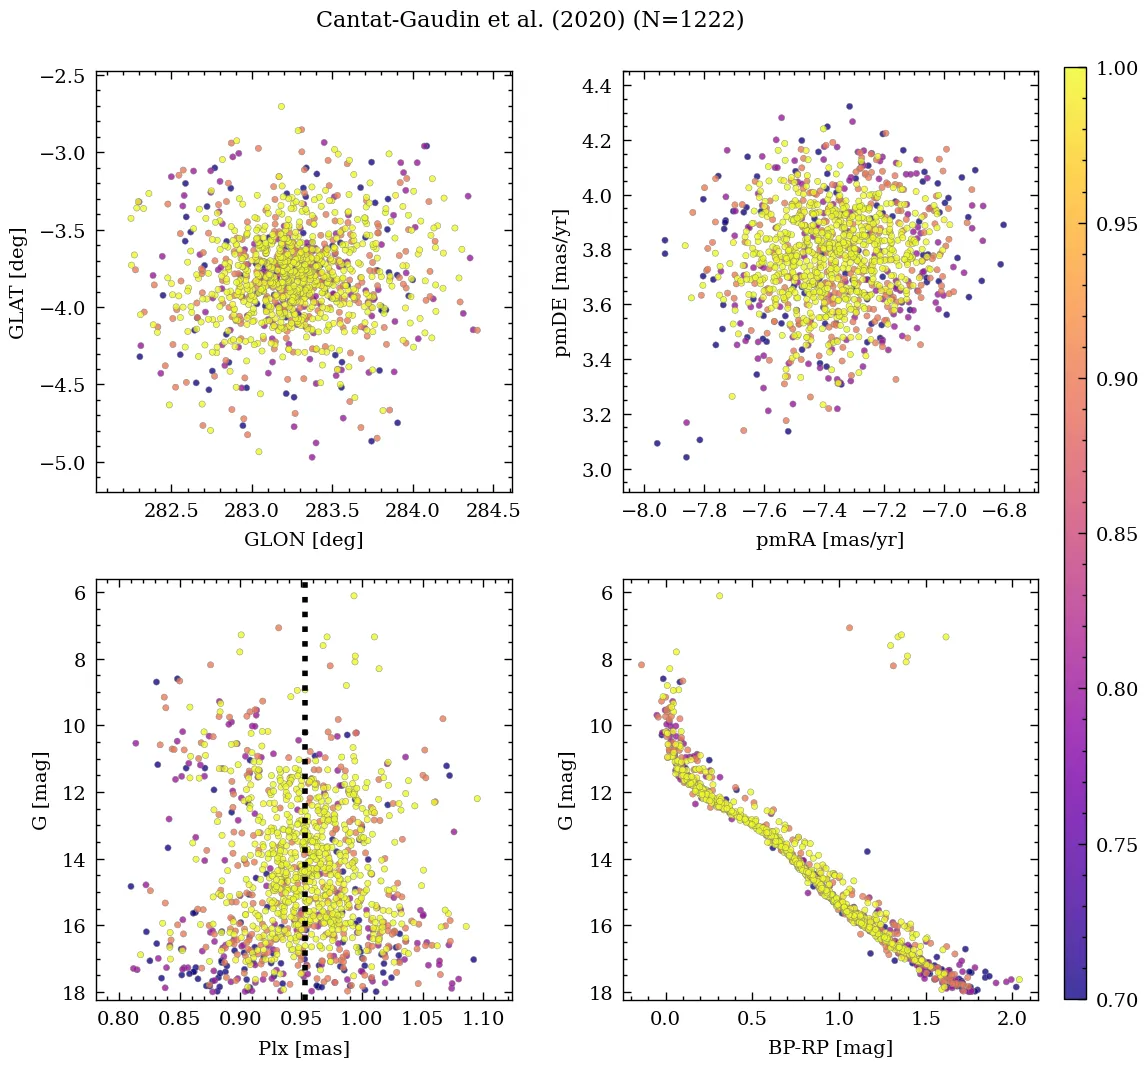
| Cantat-Gaudin et al. | 2020 | 150.553 | -60.041 | 0.954 | -7.376 | 3.779 | – |
| Cantat-Gaudin & Anders | 2020 | 150.553 | -60.041 | 0.954 | -7.376 | 3.779 | – |
| Liu & Pang | 2019 | 150.565 | -60.032 | 0.955 | -7.364 | 3.793 | – |
| Soubiran et al. | 2018 | 150.553 | -60.041 | – | – | – | -1.22 |
| Bica et al. | 2019 | 150.671 | -60.103 | – | – | – | – |
| Cantat-Gaudin et al. | 2018 | 150.553 | -60.041 | 0.954 | -7.376 | 3.779 | – |
| Dib et al. | 2018 | 150.48 | -60.11 | – | – | – | – |
| Loktin & Popova | 2017 | 150.645 | -60.119 | – | -2.22 | 2.47 | -1.4 |
| Sampedro et al. | 2017 | 150.65 | -60.12 | – | -1.92 | 2.17 | – |
| Joshi et al. | 2016 | 150.48 | -60.11 | – | – | – | – |
| Kharchenko et al. | 2016 | 150.474 | -60.106 | – | – | – | – |
| Netopil et al. | 2016 | 150.65 | -60.12 | – | – | – | – |
| Dias et al. | 2014 | 150.65 | -60.12 | – | -2.22 | 2.47 | – |
| Kharchenko et al. | 2013 | 150.48 | -60.11 | – | -7.55 | 3.9 | -1.4 |
| Gozha et al. | 2012 | 150.65 | -60.12 | – | – | – | – |
| Piskunov et al. | 2008 | 150.482 | -60.095 | – | – | – | – |
| Kharchenko et al. | 2007 | 150.64 | -60.12 | – | 0.45 | – | -1.4 |
| Piskunov et al. | 2007 | 150.482 | -60.095 | – | – | – | – |
| Ahumada & Lapasset | 2007 | 150.65 | -60.117 | – | – | – | – |
| van den Bergh | 2006 | 150.5 | -60.1 | – | – | – | – |
| Kharchenko et al. | 2005 | 150.49 | -60.1 | – | -7.43 | 4.05 | -1.42 |
| Kharchenko et al. | 2003 | 150.49 | -60.1 | – | -8.1 | 3.53 | – |
| Chen et al. | 2003 | 150.661 | -60.093 | – | -7.47 | 4.03 | 1.0 |
| Dias et al. | 2002 | 150.65 | -60.12 | – | -2.22 | 2.47 | -1.72 |
| Dambis | 1999 | 150.65 | -60.12 | – | – | – | – |
| Lynga | 1987 | 150.675 | -60.117 | – | – | – | 0.0 |
| van den Bergh & Hagen | 1975 | 150.275 | -59.867 | – | – | – | – |
| Sulentic et al. | 1973 | 150.677 | -60.121 | – | – | – | – |
💡 Note: The UCC values are estimated from its identified members.
| Reference | Year | Dist [kpc] | Av [mag] | DAv [mag] | Age [Myr] | [Fe/H] [dex] | Mass [Msun] | Bfrac | BSS |
|---|---|---|---|---|---|---|---|---|---|
| UCC | 99999– | 0.96 | 0.25 | 0.48 | 145 | 0.050 | 1606 | 0.21 | 0 |
| Malhotra et al. | 2026 | 0.99 | 0.24 | – | 144 | 0.050 | – | – | – |
| Li et al. | 2025 | 1.07 | 0.19 | – | 265 | 0.255 | – | – | – |
| Wei et al. | 2025 | 0.99 | 0.20 | – | 302 | 0.250 | 3814 | 0.17 | – |
| Almeida et al. | 2025 | 0.99 | 0.32 | – | 228 | – | 3132 | – | – |
| Hunt & Reffert | 2024 | 0.96 | 0.14 | 0.48 | 166 | – | 4168(1) | – | – |
| Cavallo et al. | 2024 | 0.97 | 0.21 | – | 282 | 0.290 | – | – | – |
| Hunt & Reffert | 2023 | 0.96 | 0.14 | 0.48 | 166 | – | – | – | – |
| Angelo et al. | 2023 | 0.93 | 0.35 | – | 126 | 0.100 | 4(1) | – | – |
| Cordoni et al. | 2023 | 0.99 | 0.32 | – | 228 | 0.096 | 3029 | 0.25 | 0(1) |
| Just et al. | 2023 | – | – | – | 200 | – | 191 | – | – |
| He et al. | 2022 | – | 0.50 | – | 112 | – | – | – | – |
| Tarricq et al. | 2022 | 0.99 | – | – | 145 | – | – | – | – |
| Jaehnig et al. | 2021 | 1.02(1) | – | – | – | – | – | – | – |
| Netopil et al. | 2022 | 0.93(1) | – | – | 158 | -0.050(1) | – | – | – |
| Rain et al. | 2021 | 1.02 | 0.19 | – | 123 | – | – | – | 0 |
| Richer et al. | 2021 | – | 0.32 | – | 130 | – | – | – | – |
| Dias et al. | 2021 | 0.99 | 0.32 | – | 228 | 0.096 | – | – | – |
| Cantat-Gaudin et al. | 2020 | 1.02 | 0.27 | – | 145 | – | – | – | – |
| Kounkel et al. | 2020 | 0.96 | 0.35 | – | 105 | – | – | – | – |
| Cantat-Gaudin & Anders | 2020 | 1.02 | – | – | – | – | – | – | – |
| Liu & Pang | 2019 | – | – | – | 66 | 0.000 | – | – | – |
| Soubiran et al. | 2018 | 1.02 | – | – | – | – | – | – | – |
| Cantat-Gaudin et al. | 2018 | 1.02 | – | – | – | – | – | – | – |
| Dib et al. | 2018 | 0.94 | – | – | 200 | – | – | – | – |
| Loktin & Popova | 2017 | 0.92 | 0.25 | – | 120 | – | – | – | – |
| Joshi et al. | 2016 | 0.94 | 0.25 | – | 200 | – | 1445 | – | – |
| Kharchenko et al. | 2016 | 0.94 | 0.25 | – | 200 | – | – | – | – |
| Netopil et al. | 2016 | 7.84 | – | – | 130 | 0.050(2) | – | – | – |
| Heiter et al. | 2014 | – | – | – | – | 0.050 | – | – | – |
| Kharchenko et al. | 2013 | 0.94 | 0.25 | – | 200 | 0.020 | – | – | – |
| Gozha et al. | 2012 | 0.91 | – | – | 124 | 0.020 | 1445 | – | – |
| Paunzen et al. | 2010 | – | – | – | – | -0.050 | – | – | – |
| Piskunov et al. | 2008 | 0.91 | 0.25 | – | 174 | – | 1766(1) | – | – |
| Piskunov et al. | 2007 | 0.91 | 0.25 | – | 174 | – | 634 | – | – |
| Ahumada & Lapasset | 2007 | – | 0.22 | – | 123 | – | – | – | 5 |
| van den Bergh | 2006 | 0.91 | 0.22 | – | 123 | – | – | – | – |
| Kharchenko et al. | 2005 | 0.91 | 0.25 | – | 174 | – | – | – | – |
| Kharchenko et al. | 2003 | 0.91 | 0.22 | – | – | – | – | – | – |
| Chen et al. | 2003 | 0.91 | 0.22 | – | 120 | 0.020(1) | – | – | – |
| Dias et al. | 2002 | 0.91 | 0.22 | – | 124 | 0.020 | – | – | – |
| Dambis | 1999 | 0.95 | 0.25 | – | 63 | – | – | – | – |
| Lynga | 1987 | 0.90 | 0.00 | – | 107 | 0.010 | – | – | – |
(N): Indicates that there are N extra values assigned to this parameter in the corresponding reference.
Malhotra et al. (2026)
Lowest/Highest stellar mass in the catalogue with a mass-ratio estimate: 0.45/3.74 Msun
Almeida et al. (2025)
Mass determination: good fit. Isochrone match: good fit. Gold sample.
Cavallo et al. (2024)
Gold sample.
Hunt & Reffert (2024)
Classified as open cluster. CMD class: 1.00 (50th percentile).
Hunt & Reffert (2023)
Classified as open cluster. CMD class: 1.00 (50th percentile).
Richer et al. (2021)
The expected number of WDs is 38.2, 1 WD candidate found, and 0 WD candidates found in the wide search.
Hu et al. (2021)
Ellipticities (core, all): e_core=0.0758, e_all=0.0951.
Ahumada & Lapasset (2007)
The apparent cluster diameter was taken from (1988A&AS...75..353S). In the ubvy-beta photometric study (1982PASP...94..232S) stars 8 (= 108 WEBDA), 9 (= 23), 14 (= 210), 15 (= 196), 16 (= 25), 18 (= 211), 61 (= 234), and 124 (= 256) are considered to be blue straggler candidates according to their position in the beta-c diagram: five of them show peculiarities. The following spectra and membership probabilities are from (2001AJ....121.2657G): star 23, B3V, 99%; star 33, B2.5V, 96%; star 149, B3III, 81%; star 180, B2Ve, 93%; star 196, B6V, 95%. Star 108, which also appears as a straggler, is not a cluster member (2001AJ....121.2657G).