NGC 2318
(MWSC 1050; FoF 2057; CMa09)
0.77
UTI
0.78
CN
0.4
Cdens
0.75
CC3
0.95
Clit
1.0
Cdup
Nm (P>50%)
176
Core radius and density
3.2 [pc], 2.0 [pc-2]
- CN 0.78 Rich
- Cdens 0.4 Loose
- CC3 0.75 High quality
- Clit 0.95 Very well-studied
- Cdup 1.0 Unique
 MOCA
MOCA
Overview
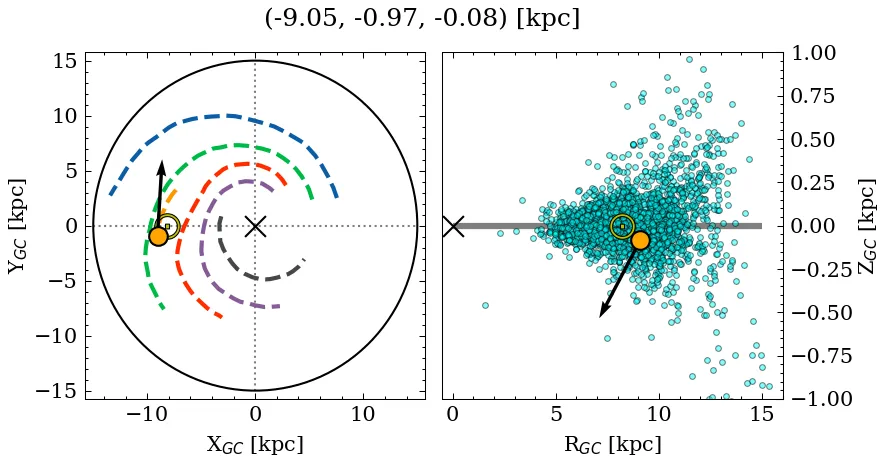
NGC 2318 is a rich, loose object of high C3 quality. Its parallax locates it at a relatively close distance, below the mid-plane, affected by low extinction. It is catalogued as a near-solar metallicity, intermediate-age cluster, but with a large variance across recent sources for the metallicity and mass parameters (see Parameters). It is very well-studied in the literature.
Data
| Reference | Year | RA [deg] | DEC [deg] | Plx [mas] | pmRA [mas/yr] | pmDE [mas/yr] | Rv [km/s] |
|---|---|---|---|---|---|---|---|
| UCC | 99999– | 104.864 | -13.83 | 0.723 | -1.764 | -2.155 | 6.408 |
| Li et al. | 2026 | 104.85 | -13.82 | – | – | – | – |
| Otto et al. | 2026 | 104.873 | -13.759 | – | -1.78 | -2.2 | 8.4 |
| Schweers & McSwain | 2026 | 104.86 | -13.81 | – | – | – | – |
| Li et al. | 2025 | 104.854 | -13.822 | 0.716 | -1.781 | -2.198 | – |
| Hu & Soubiran | 2025 | 104.86 | -13.813 | – | – | – | – |
| Almeida et al. | 2025 | 104.865 | -13.822 | – | – | – | – |
| Hunt & Reffert | 2024 | 104.873 | -13.759 | 0.706 | -1.768 | -2.136 | 4.313 |
| Cavallo et al. | 2024 | 104.86 | -13.813 | 0.712 | – | – | – |
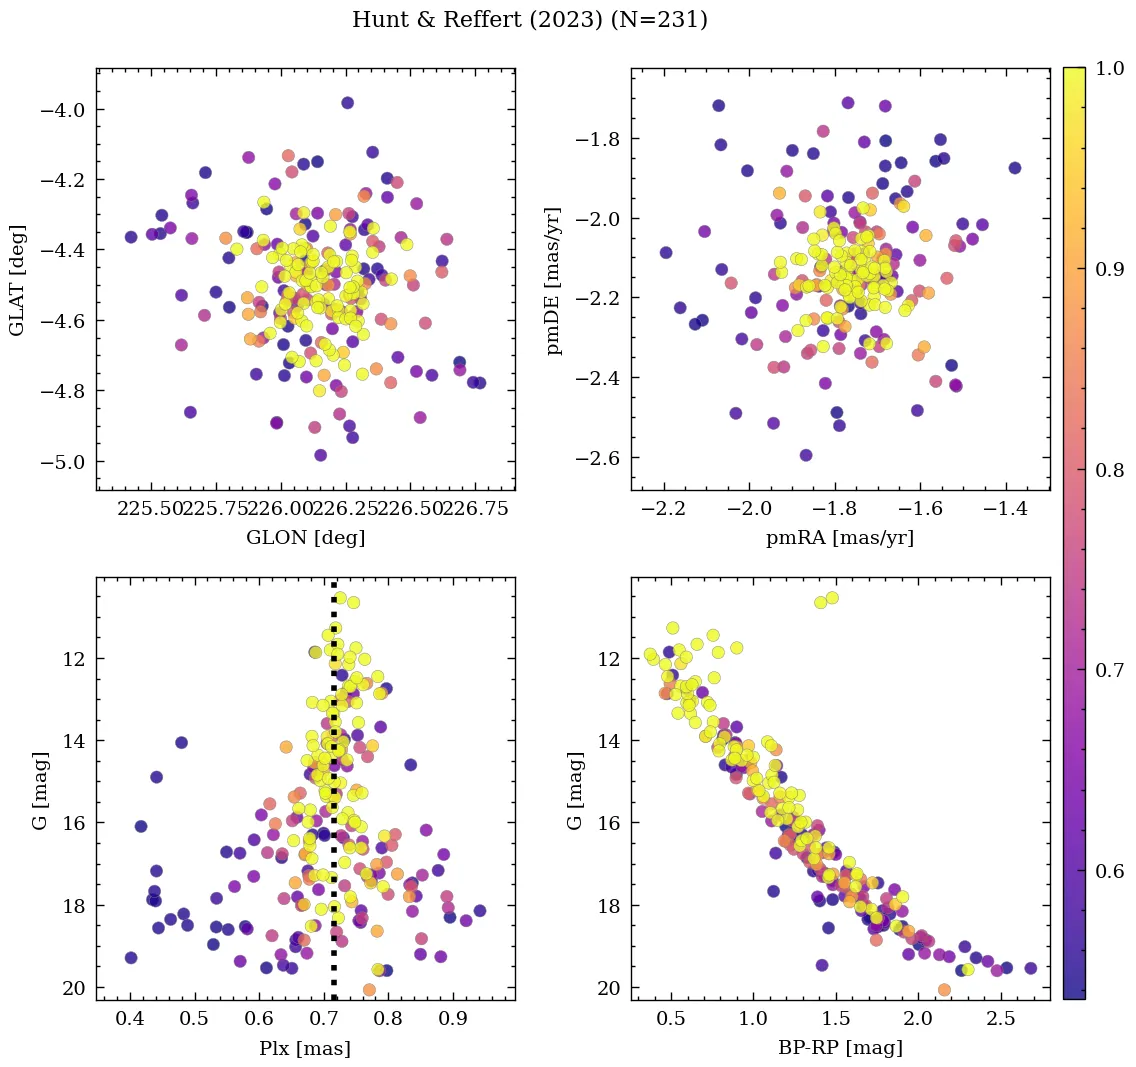
| Hunt & Reffert | 2023 | 104.873 | -13.759 | 0.706 | -1.768 | -2.136 | 4.313 |
| Almeida et al. | 2023 | 104.882 | -13.842 | – | – | – | – |
| Just et al. | 2023 | 104.863 | -13.66 | – | – | – | – |
| Tarricq et al. | 2022 | 104.877 | -13.892 | 0.716 | -1.758 | -2.151 | – |
| Jadhav & Subramaniam | 2021 | 104.854 | -13.822 | – | – | – | – |
| Santos-Silva et al. | 2021 | 104.87 | -13.81 | 0.71 | -1.78 | -2.18 | – |
| Dias et al. | 2021 | 104.865 | -13.822 | 0.717 | -1.781 | -2.194 | 8.652 |
| Spina et al. | 2021 | 104.853 | -13.82 | 0.712 | -1.785 | -2.179 | – |
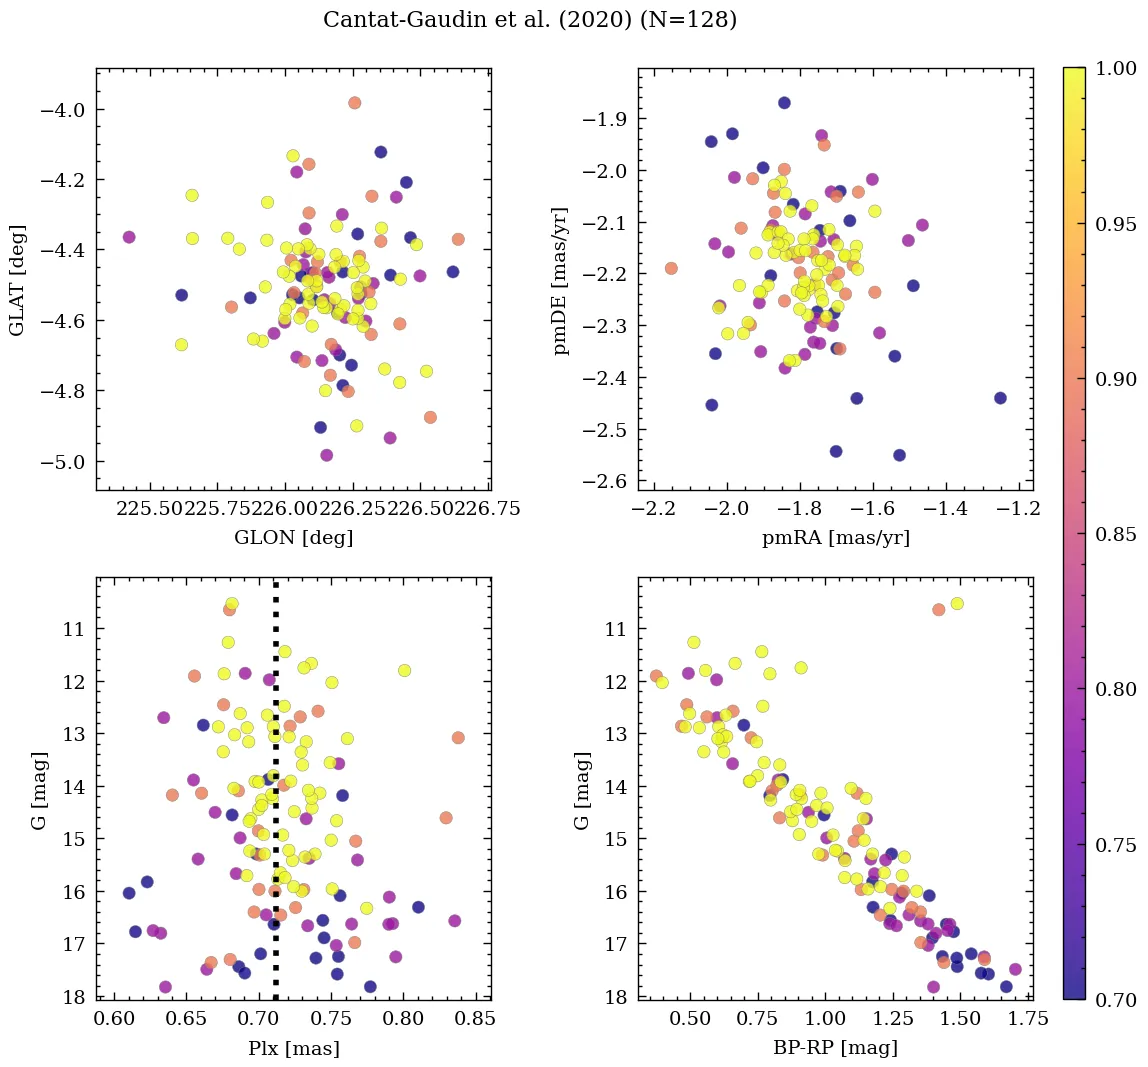
| Cantat-Gaudin et al. | 2020 | 104.854 | -13.822 | 0.716 | -1.781 | -2.198 | – |
| Donor et al. | 2020 | 104.87 | -13.662 | – | -1.94 | -2.3 | 8.6 |
| Cantat-Gaudin & Anders | 2020 | 104.854 | -13.822 | 0.716 | -1.781 | -2.198 | – |
| Liu & Pang | 2019 | 104.862 | -13.809 | 0.712 | -1.778 | -2.148 | – |
| Soubiran et al. | 2018 | 104.854 | -13.822 | – | – | – | 8.66 |
| Bica et al. | 2019 | 104.877 | -13.704 | – | – | – | – |
| Cantat-Gaudin et al. | 2018 | 104.854 | -13.822 | 0.716 | -1.781 | -2.198 | – |
| Dib et al. | 2018 | 104.869 | -13.662 | – | – | – | – |
| Loktin & Popova | 2017 | 104.865 | -13.697 | – | 0.293 | 0.55 | – |
| Sampedro et al. | 2017 | 104.862 | -13.698 | – | -0.66 | 0.29 | – |
| Joshi et al. | 2016 | 104.869 | -13.662 | – | – | – | – |
| Dias et al. | 2016 | 104.862 | -13.698 | – | -1.04 | 0.17 | – |
| Kharchenko et al. | 2016 | 104.863 | -13.66 | – | – | – | – |
| Tadross | 2014 | 104.862 | -13.698 | – | – | – | – |
| Dias et al. | 2014 | 104.862 | -13.698 | – | -1.04 | 0.17 | – |
| Kharchenko et al. | 2013 | 104.869 | -13.662 | – | 0.54 | 2.43 | – |
| Dias et al. | 2002 | 104.862 | -13.698 | – | – | – | – |
💡 Note: The UCC values are estimated from its identified members.
| Reference | Year | Dist [kpc] | Av [mag] | DAv [mag] | Age [Myr] | [Fe/H] [dex] | Mass [Msun] | Bfrac | BSS |
|---|---|---|---|---|---|---|---|---|---|
| UCC | 99999– | 1.34 | 0.97 | 1.53 | 506 | -0.030 | 561 | 0.56 | 0 |
| Otto et al. | 2026 | – | – | – | 437 | -0.050(15) | – | – | – |
| Schweers & McSwain | 2026 | 1.14 | – | – | 501 | – | – | – | – |
| Li et al. | 2025 | 1.24 | 0.73 | – | 833 | -0.037 | – | – | – |
| Hu & Soubiran | 2025 | – | – | – | – | -0.160(5) | – | – | – |
| Almeida et al. | 2025 | 1.23 | 0.95 | – | 532 | – | 332 | – | – |
| Hunt & Reffert | 2024 | 1.31 | 0.86 | 1.53 | 456 | – | 746(1) | – | – |
| Cavallo et al. | 2024 | 1.46 | 0.92 | – | 575 | 0.590 | – | – | – |
| Hunt & Reffert | 2023 | 1.31 | 0.86 | 1.53 | 456 | – | – | – | – |
| Almeida et al. | 2023 | 1.28 | 1.07 | – | 512 | -0.013 | 561(1) | 0.56 | – |
| Just et al. | 2023 | – | – | – | 562 | – | 70 | – | – |
| Spina et al. | 2022 | – | – | – | – | -0.030 | – | – | – |
| Tarricq et al. | 2022 | 1.35 | – | – | 447 | – | – | – | – |
| Jadhav & Subramaniam | 2021 | 1.39 | 0.89 | – | 437 | – | 662 | – | 0(1) |
| Santos-Silva et al. | 2021 | 1.35(1) | 1.08(1) | – | 329(1) | 0.070(1) | – | – | – |
| Dias et al. | 2021 | 1.23 | 0.95 | – | 532 | 0.009 | – | – | – |
| Spina et al. | 2021 | 1.41 | – | – | 437 | -0.033(20) | – | – | – |
| Cantat-Gaudin et al. | 2020 | 1.39 | 0.89 | – | 437 | – | – | – | – |
| Kounkel et al. | 2020 | 1.34 | 1.14 | – | 447 | – | – | – | – |
| Donor et al. | 2020 | – | – | – | – | -0.030 | – | – | – |
| Cantat-Gaudin & Anders | 2020 | 1.34 | – | – | – | – | – | – | – |
| Liu & Pang | 2019 | – | – | – | 1150 | -0.500 | – | – | – |
| Soubiran et al. | 2018 | 1.34 | – | – | – | – | – | – | – |
| Cantat-Gaudin et al. | 2018 | 1.34 | – | – | – | – | – | – | – |
| Dib et al. | 2018 | 1.71 | – | – | 562 | – | – | – | – |
| Loktin & Popova | 2017 | 2.13 | 0.97 | – | 646 | – | – | – | – |
| Joshi et al. | 2016 | 1.71 | 1.38 | – | 562 | – | – | – | – |
| Dias et al. | 2016 | 1.33 | 2.05 | – | 50 | – | – | – | – |
| Kharchenko et al. | 2016 | 1.71 | 1.38 | – | 562 | – | – | – | – |
| Tadross | 2014 | 1.33 | 2.05 | – | 50 | – | – | – | – |
| Kharchenko et al. | 2013 | 1.71 | 1.38 | – | 562 | – | – | – | – |
(N): Indicates that there are N extra values assigned to this parameter in the corresponding reference.

Li et al. (2026)
Tidal & Core radii: r_t=23+/-19.3 [pc], r_c=0.61+/-0.06 [pc]; stars within r_t: N~138
Almeida et al. (2025)
Mass determination: intermediate fit. Isochrone match: good fit.
Cavallo et al. (2024)
Gold sample.
Hunt & Reffert (2024)
Classified as open cluster. CMD class: 0.99 (50th percentile).
Hunt & Reffert (2023)
Classified as open cluster. CMD class: 0.99 (50th percentile).
Hu et al. (2021)
Ellipticities (core, all): e_core=0.2342, e_all=0.2673.
Piecka & Paunzen (2021)
Belongs to cluster aggregate 'Agg49' along with Ruprecht 8.
Bica et al. (2019)
Original NGC and IC catalogues at Vizier: NGC 2000.0, Sky Publishing, ed. Sinnott 1988 (1997yCat.7118....0S).