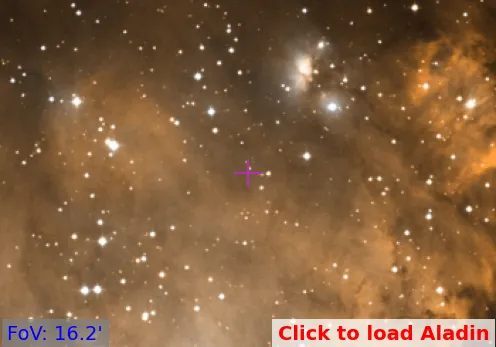
NGC 2175
0.70
UTI
0.76
CN
0.54
Cdens
0.75
CC3
0.72
Clit
1.0
Cdup
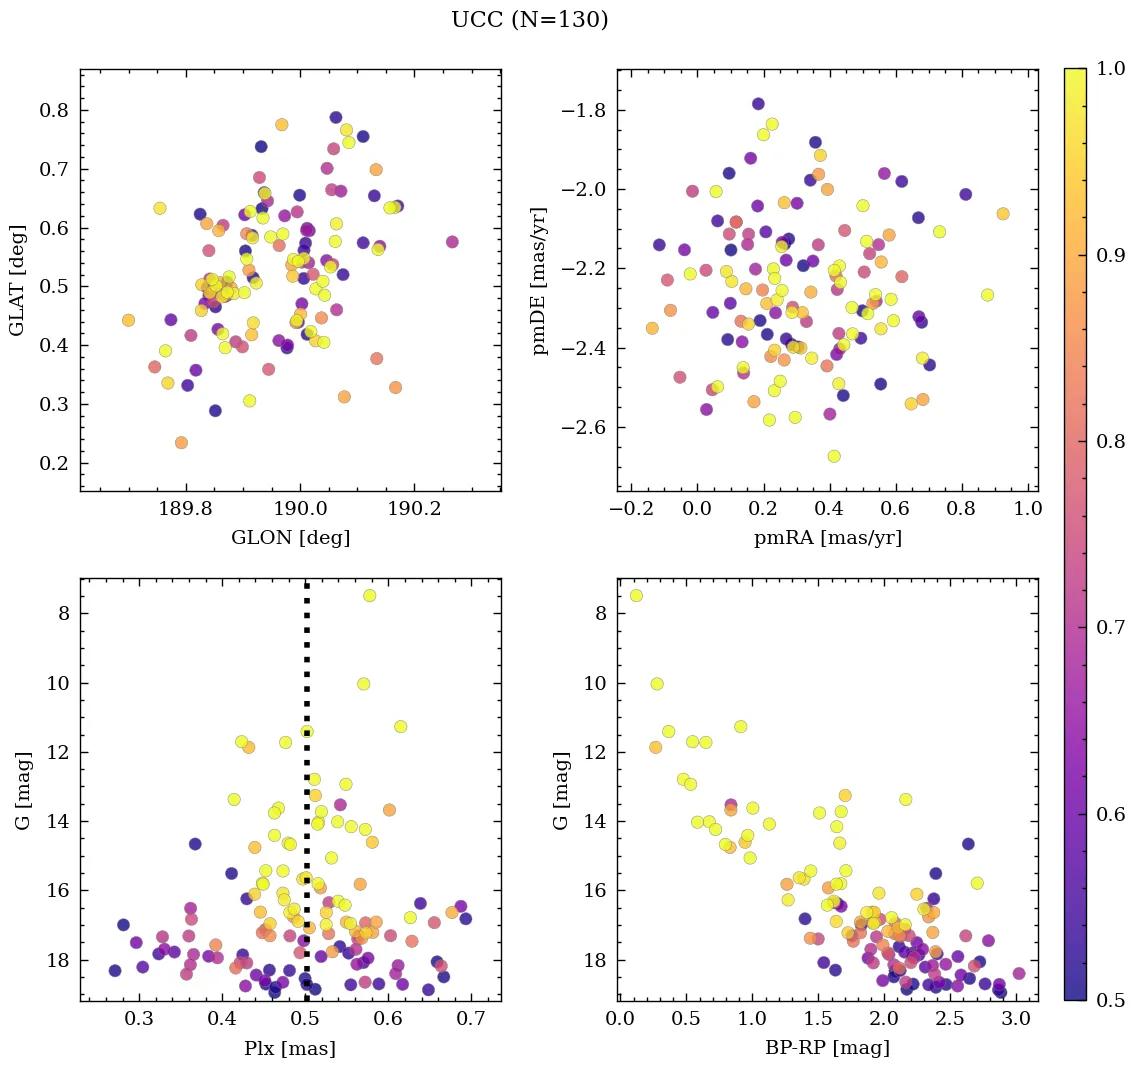
Nm (P>50%)
130
Core radius and density
1.7 [pc], 2.7 [pc-2]
- CN 0.76 Rich
- Cdens 0.54 Moderately dense
- CC3 0.75 High quality
- Clit 0.72 Moderately studied
- Cdup 1.0 Unique
 MOCA
MOCA
Overview
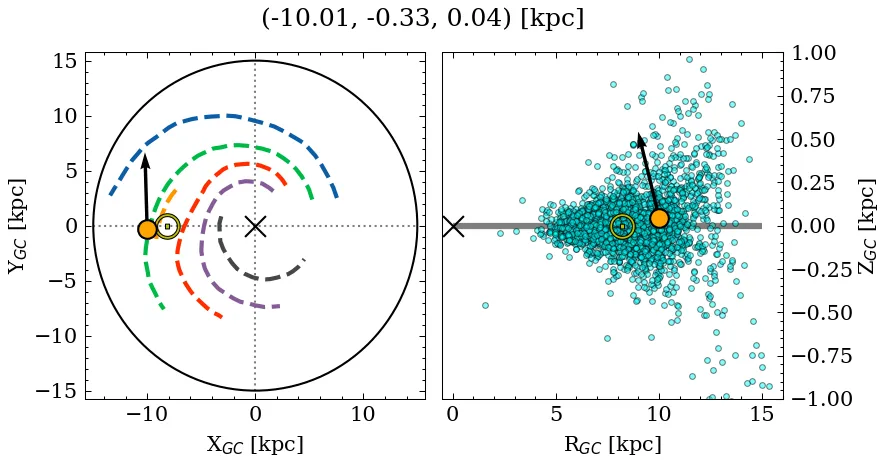
NGC 2175 is a rich, moderately dense object of high C3 quality. Its parallax locates it at a relatively close distance, near the mid-plane, affected by moderate extinction. It is catalogued as a near-solar metallicity, very young cluster (see Parameters). It is moderately studied in the literature.
Note: This object shares a moderate percentage of members with 5 later reported entries. See table with shared members information.
Data
| Reference | Year | RA [deg] | DEC [deg] | Plx [mas] | pmRA [mas/yr] | pmDE [mas/yr] | Rv [km/s] |
|---|---|---|---|---|---|---|---|
| UCC | 99999– | 92.404 | 20.597 | 0.501 | 0.289 | -2.263 | 23.039 |
| Hunt & Reffert | 2024 | 92.349 | 20.636 | 0.512 | 0.386 | -2.246 | 23.043 |
| Cavallo et al. | 2024 | 92.51 | 20.556 | 0.517 | – | – | – |
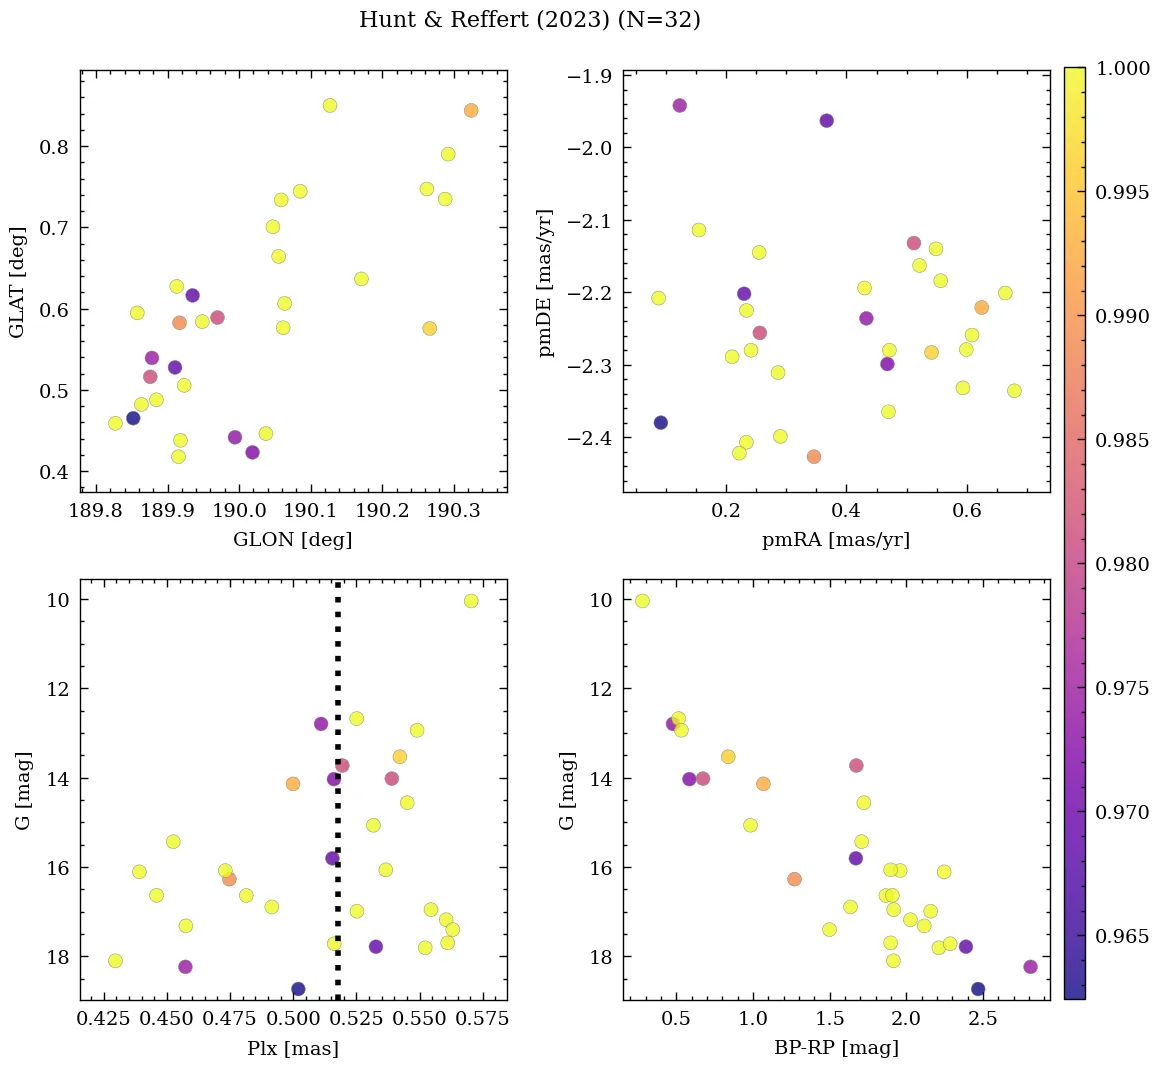
| Hunt & Reffert | 2023 | 92.349 | 20.636 | 0.512 | 0.386 | -2.246 | 23.043 |
| Jaehnig et al. | 2021 | 92.433 | 20.562 | 0.513 | 0.419 | -2.33 | – |
| Dias et al. | 2018 | – | – | – | 0.24 | -4.0 | – |
| Dib et al. | 2018 | 92.422 | 20.505 | – | – | – | – |
| Loktin & Popova | 2017 | 92.415 | 20.487 | – | 0.382 | -2.656 | 22.0 |
| Sampedro et al. | 2017 | 92.412 | 20.487 | – | 0.85 | -5.34 | – |
| Joshi et al. | 2016 | 92.422 | 20.505 | – | – | – | – |
| Dias et al. | 2016 | 92.412 | 20.487 | – | 1.8 | -2.26 | 23.2 |
| Dias et al. | 2014 | 92.412 | 20.487 | – | 0.37 | -5.39 | – |
| Gozha et al. | 2012 | 92.413 | 20.487 | – | – | – | – |
| Bukowiecki et al. | 2011 | 92.471 | 20.509 | – | – | – | – |
| Kharchenko et al. | 2007 | 92.41 | 20.49 | – | 0.18 | – | – |
| Ahumada & Lapasset | 2007 | 92.425 | 20.483 | – | – | – | – |
| van den Bergh | 2006 | 92.425 | 20.5 | – | – | – | – |
| Chen et al. | 2003 | 92.417 | 20.309 | – | 1.8 | -2.26 | 22.0 |
| Dias et al. | 2002 | 92.412 | 20.487 | – | 1.8 | -2.26 | 22.0 |
| Dambis | 1999 | 92.412 | 20.487 | – | – | – | – |
| Lynga | 1987 | 92.435 | 20.319 | – | – | – | – |
| Sulentic et al. | 1973 | 92.447 | 20.328 | – | – | – | – |
| Alter et al. | 1970 | 92.435 | 20.319 | – | – | – | – |
💡 Note: The UCC values are estimated from its identified members.
| Reference | Year | Dist [kpc] | Av [mag] | DAv [mag] | Age [Myr] | [Fe/H] [dex] | Mass [Msun] | Bfrac | BSS |
|---|---|---|---|---|---|---|---|---|---|
| UCC | 99999– | 1.64 | 1.85 | 1.89 | 9 | -0.300 | 229 | – | 0 |
| Hunt & Reffert | 2024 | 1.79 | 1.49 | 1.89 | 6 | – | 229(1) | – | – |
| Cavallo et al. | 2024 | 1.78 | 1.73 | – | 7 | -0.300 | – | – | – |
| Hunt & Reffert | 2023 | 1.79 | 1.49 | 1.89 | 6 | – | – | – | – |
| Jaehnig et al. | 2021 | 2.00(1) | – | – | – | – | – | – | – |
| Dib et al. | 2018 | 1.64 | – | – | 10 | – | – | – | – |
| Loktin & Popova | 2017 | 1.62 | 1.85 | – | 9 | – | – | – | – |
| Joshi et al. | 2016 | 1.64 | 1.77 | – | 10 | – | – | – | – |
| Dias et al. | 2016 | 1.63 | 1.89 | – | 9 | – | – | – | – |
| Gozha et al. | 2012 | 1.63 | – | – | 9 | – | – | – | – |
| Ahumada & Lapasset | 2007 | – | 1.89 | – | 9 | – | – | – | 0 |
| van den Bergh | 2006 | 1.63 | 1.89 | – | 9 | – | – | – | – |
| Chen et al. | 2003 | 1.63 | – | – | 0 | – | – | – | – |
| Dias et al. | 2002 | 1.63 | 1.89 | – | 9 | – | – | – | – |
| Dambis | 1999 | 1.79 | 2.46 | – | 3 | – | – | – | – |
| Lynga | 1987 | 1.95 | 1.20 | – | 1 | – | – | – | – |
| Alter et al. | 1970 | 1.95 | – | – | – | – | – | – | – |
(N): Indicates that there are N extra values assigned to this parameter in the corresponding reference.
Palma et al. (2025)
Part of multiple system G118, along with HSC_1504, Pismis_27, UBC_1303 and FSR_0902.
Cavallo et al. (2024)
Silver sample.
Hunt & Reffert (2024)
Classified as open cluster. CMD class: 0.81 (50th percentile).
Hunt & Reffert (2023)
Classified as open cluster. CMD class: 0.81 (50th percentile).
Ahumada & Lapasset (2007)
The dereddened colour-magnitude diagram of (1975A&A....43..259G) was examined.