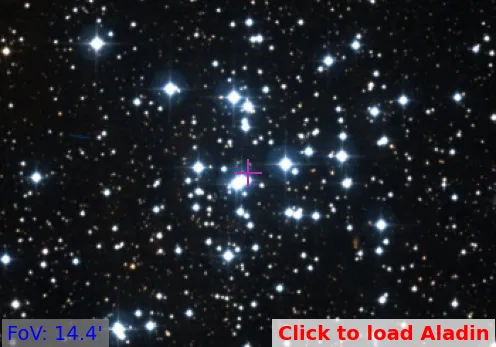
NGC 1960
(MWSC 594)
0.92
UTI
0.87
CN
1.0
Cdens
0.75
CC3
1.0
Clit
1.0
Cdup
Nm (P>50%)
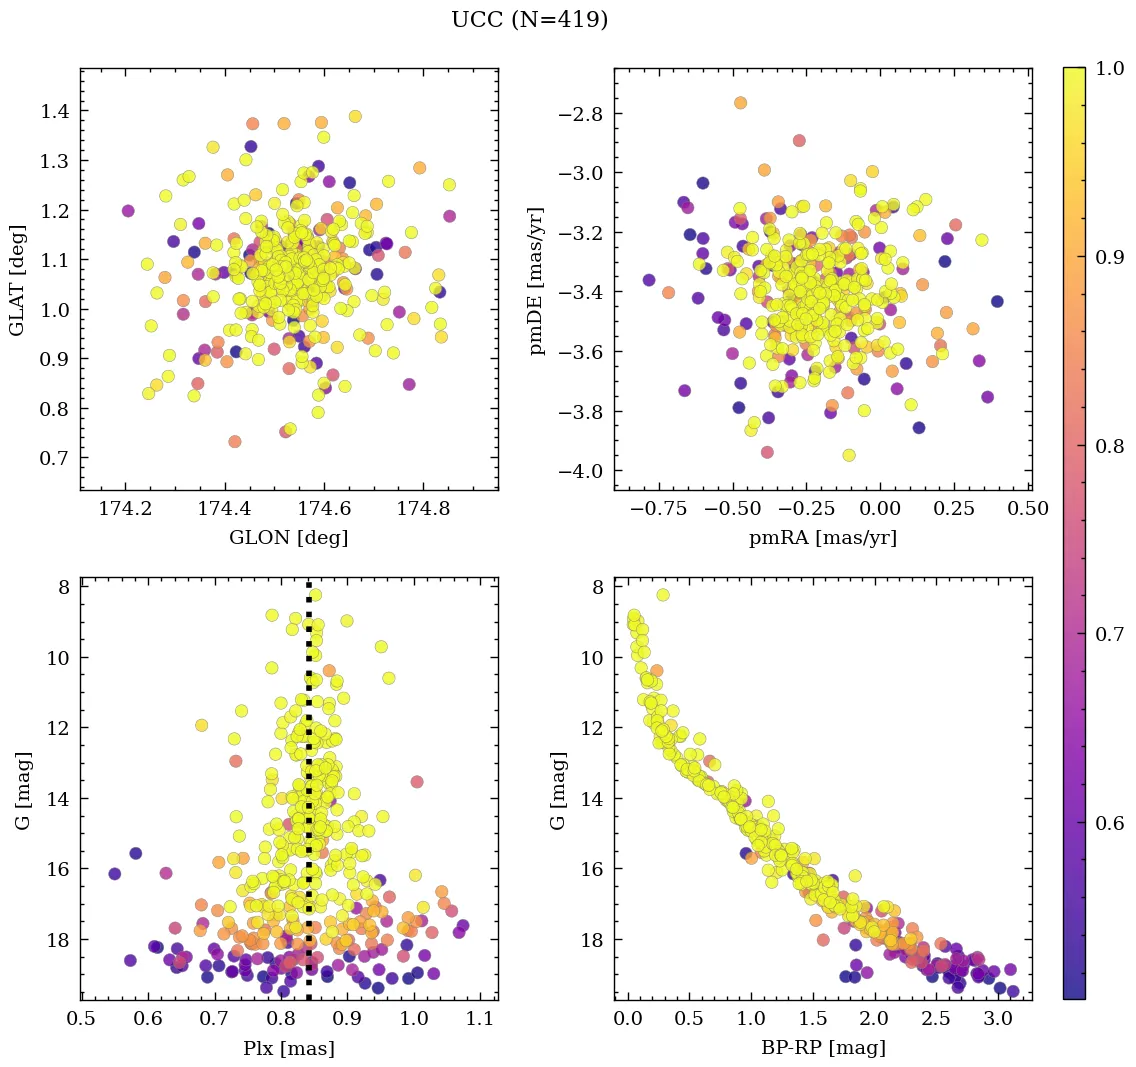
419
Core radius and density
1.0 [pc], 25 [pc-2]
- CN 0.87 Rich
- Cdens 1.0 Very dense
- CC3 0.75 High quality
- Clit 1.0 Very well-studied
- Cdup 1.0 Unique
 MOCA
MOCA
Overview
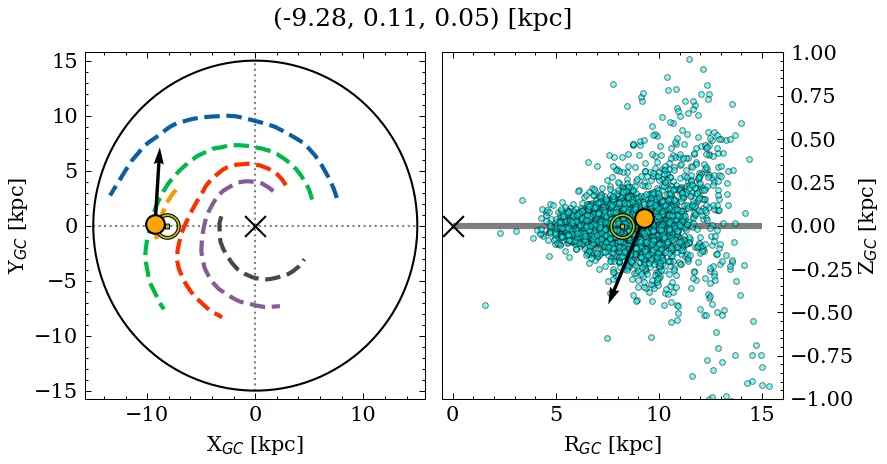
NGC 1960 is a rich, very dense object of high C3 quality. Its parallax locates it at a relatively close distance, near the mid-plane, affected by low extinction. It is catalogued as a near-solar metallicity, young cluster, but with a large variance across recent sources for the mass parameter (see Parameters). It is very well-studied in the literature.
Data
| Reference | Year | RA [deg] | DEC [deg] | Plx [mas] | pmRA [mas/yr] | pmDE [mas/yr] | Rv [km/s] |
|---|---|---|---|---|---|---|---|
| UCC | 99999– | 84.086 | 34.137 | 0.842 | -0.221 | -3.401 | -3.23 |
| Li et al. | 2026 | 84.09 | 34.14 | – | – | – | – |
| Schweers & McSwain | 2026 | 84.09 | 34.14 | – | – | – | – |
| Li et al. | 2025 | 84.084 | 34.135 | 0.835 | -0.155 | -3.388 | – |
| Yang et al. | 2025 | 84.085 | 34.134 | – | – | – | – |
| Almeida et al. | 2025 | 84.079 | 34.134 | – | – | – | – |
| Zhang et al. | 2024 | 84.085 | 34.134 | – | – | – | – |
| Hunt & Reffert | 2024 | 84.085 | 34.134 | 0.843 | -0.218 | -3.414 | -5.135 |
| Celli et al. | 2024 | 84.084 | 34.135 | – | – | – | – |
| Cavallo et al. | 2024 | 84.086 | 34.134 | 0.844 | – | – | – |
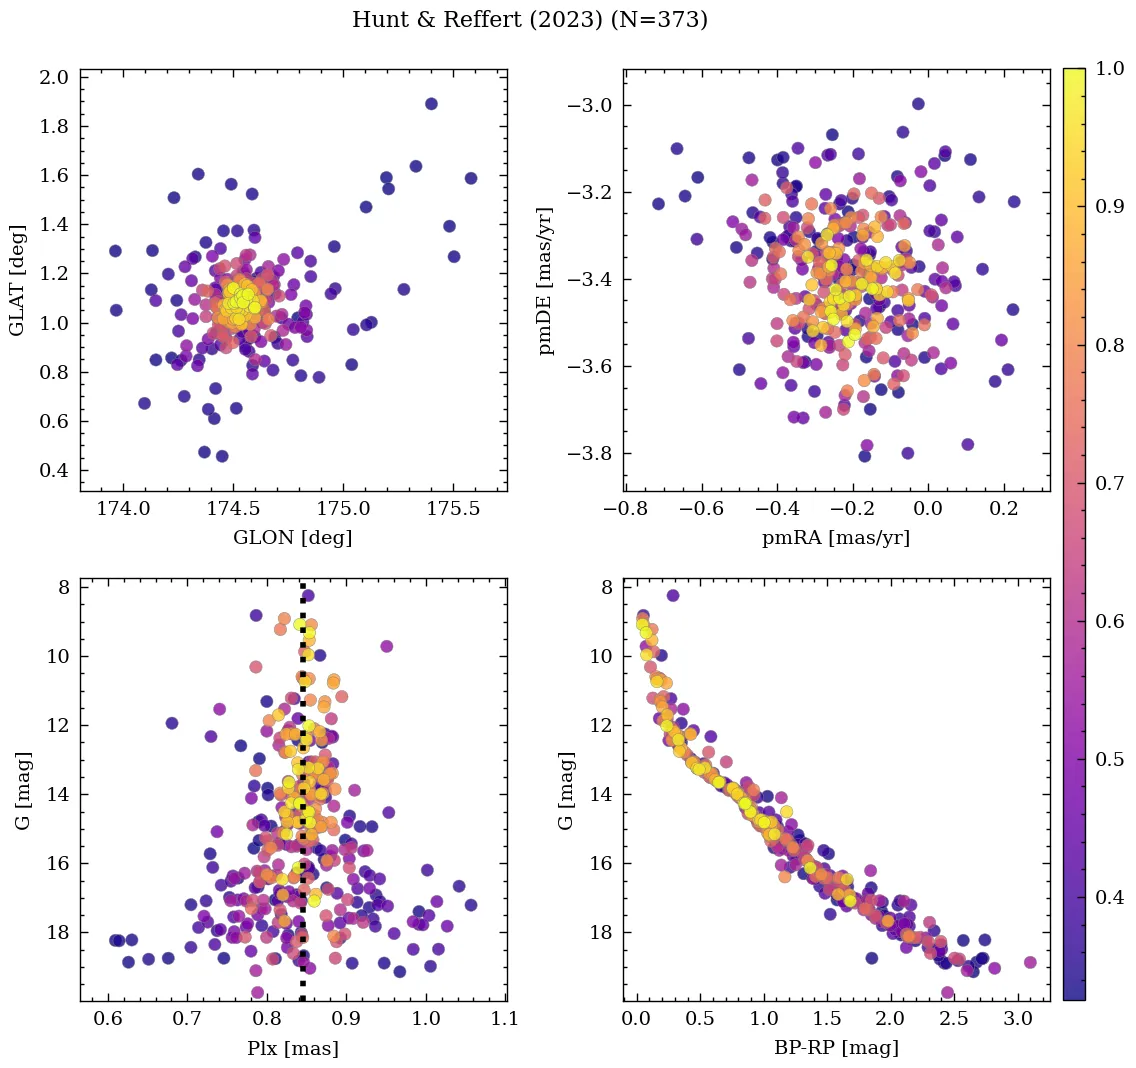
| Hunt & Reffert | 2023 | 84.085 | 34.134 | 0.843 | -0.218 | -3.414 | -5.135 |
| Almeida et al. | 2023 | 84.084 | 34.131 | – | – | – | – |
| Just et al. | 2023 | 84.073 | 34.159 | – | – | – | – |
| He et al. | 2022 | 84.085 | 34.134 | 0.845 | -0.219 | -3.406 | – |
| Fu et al. | 2022 | 84.084 | 34.135 | – | – | – | -9.697 |
| Jaehnig et al. | 2021 | 84.089 | 34.137 | 0.868 | -0.162 | -3.372 | – |
| Rain et al. | 2021 | 84.084 | 34.135 | 0.835 | -0.155 | -3.388 | – |
| Richer et al. | 2021 | 84.081 | 34.137 | 0.659 | -0.135 | -3.37 | – |
| Dias et al. | 2021 | 84.079 | 34.134 | 0.832 | -0.146 | -3.395 | – |
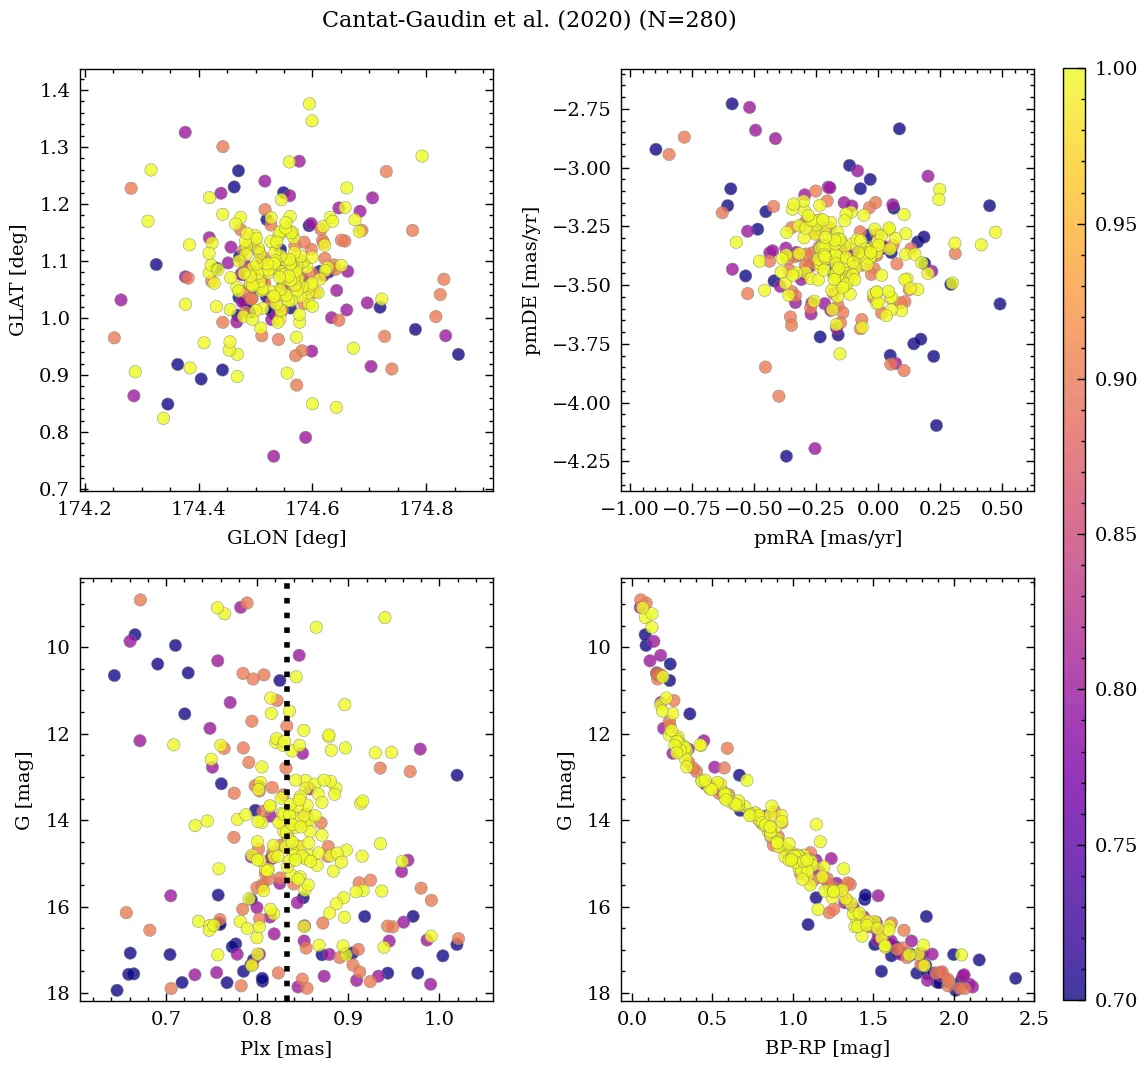
| Cantat-Gaudin et al. | 2020 | 84.084 | 34.135 | 0.835 | -0.155 | -3.388 | – |
| Sánchez et al. | 2020 | 84.075 | 34.14 | – | -0.02 | -3.339 | – |
| Zhong et al. | 2020 | 84.084 | 34.135 | – | -0.155 | -3.388 | -12.091 |
| Cantat-Gaudin & Anders | 2020 | 84.084 | 34.135 | 0.835 | -0.155 | -3.388 | – |
| Bossini et al. | 2019 | 84.084 | 34.135 | – | – | – | – |
| Soubiran et al. | 2018 | 84.084 | 34.135 | – | – | – | 7.03 |
| Cantat-Gaudin et al. | 2018 | 84.084 | 34.135 | 0.835 | -0.155 | -3.388 | – |
| Dias et al. | 2018 | – | – | – | 0.26 | -3.38 | – |
| Dib et al. | 2018 | 84.082 | 34.158 | – | – | – | – |
| Loktin & Popova | 2017 | 84.075 | 34.14 | – | 0.364 | -1.456 | -1.2 |
| Sampedro et al. | 2017 | 84.075 | 34.14 | – | 0.36 | -5.86 | – |
| Joshi et al. | 2016 | 84.082 | 34.158 | – | – | – | – |
| Dias et al. | 2016 | 84.075 | 34.14 | – | -0.22 | -5.66 | -17.83 |
| Kharchenko et al. | 2016 | 84.073 | 34.159 | – | – | – | – |
| Dias et al. | 2014 | 84.075 | 34.14 | – | -0.22 | -5.66 | – |
| Kharchenko et al. | 2013 | 84.082 | 34.158 | – | 0.91 | -4.35 | -1.2 |
| Gozha et al. | 2012 | 84.075 | 34.14 | – | – | – | – |
| Kharchenko et al. | 2012 | 84.082 | 34.158 | – | 0.91 | -4.35 | -1.18 |
| Bukowiecki et al. | 2011 | 84.096 | 34.121 | – | – | – | – |
| Kharchenko et al. | 2009 | 84.07 | 34.143 | – | – | – | – |
| Piskunov et al. | 2008 | 84.07 | 34.143 | – | – | – | – |
| Kharchenko et al. | 2007 | 84.07 | 34.14 | – | 0.27 | – | -1.18 |
| Piskunov et al. | 2007 | 84.07 | 34.143 | – | – | – | – |
| Ahumada & Lapasset | 2007 | 84.075 | 34.133 | – | – | – | – |
| van den Bergh | 2006 | 84.05 | 34.14 | – | – | – | – |
| Kharchenko et al. | 2005 | 84.07 | 34.14 | – | 0.5 | -4.94 | -1.18 |
| Kharchenko et al. | 2003 | 84.06 | 34.15 | – | 0.02 | -5.14 | – |
| Chen et al. | 2003 | 83.979 | 34.13 | – | 1.1 | -4.08 | -4.0 |
| Dias et al. | 2002 | 84.075 | 34.14 | – | 0.15 | -4.05 | -4.0 |
| Dambis | 1999 | 84.075 | 34.14 | – | – | – | – |
| Lynga | 1987 | 84.033 | 34.135 | – | – | – | -4.0 |
| Sulentic et al. | 1973 | 84.039 | 34.132 | – | – | – | – |
| Alter et al. | 1970 | 84.033 | 34.135 | – | – | – | – |
💡 Note: The UCC values are estimated from its identified members.
| Reference | Year | Dist [kpc] | Av [mag] | DAv [mag] | Age [Myr] | [Fe/H] [dex] | Mass [Msun] | Bfrac | BSS |
|---|---|---|---|---|---|---|---|---|---|
| UCC | 99999– | 1.16 | 0.73 | 0.93 | 28 | -0.101 | 688 | 0.53 | 0 |
| Schweers & McSwain | 2026 | 1.09 | – | – | 40 | – | – | – | – |
| Li et al. | 2025 | 1.06 | 0.80 | – | 23 | -0.145 | – | – | – |
| Yang et al. | 2025 | – | – | – | 27 | -0.190(3) | – | – | – |
| Almeida et al. | 2025 | 1.09 | 0.93 | – | 30 | – | 759 | – | – |
| Zhang et al. | 2024 | – | – | – | – | -0.191(1) | – | – | – |
| Hunt & Reffert | 2024 | 1.12 | 0.79 | 0.93 | 27 | – | 1316(1) | – | – |
| Celli et al. | 2024 | – | – | – | 28 | – | 886 | – | – |
| Cavallo et al. | 2024 | 1.18 | 0.77 | – | 25 | 0.030 | – | – | – |
| Hunt & Reffert | 2023 | 1.12 | 0.79 | 0.93 | 27 | – | – | – | – |
| Almeida et al. | 2023 | 1.12 | 0.90 | – | 28 | -0.026 | 629(1) | 0.53 | – |
| Just et al. | 2023 | – | – | – | 37 | – | 163 | – | – |
| He et al. | 2022 | – | 1.00 | – | 20 | – | – | – | – |
| Fu et al. | 2022 | – | – | – | – | -0.101 | – | – | – |
| Jaehnig et al. | 2021 | 1.15(1) | – | – | – | – | – | – | – |
| Rain et al. | 2021 | 1.16 | 0.66 | – | 25 | – | – | – | 0 |
| Richer et al. | 2021 | – | 0.94 | – | – | – | – | – | – |
| Dias et al. | 2021 | 1.09 | 0.93 | – | 30 | -0.030 | – | – | – |
| Cantat-Gaudin et al. | 2020 | 1.16 | 0.63 | – | 28 | – | – | – | – |
| Kounkel et al. | 2020 | 1.14 | 0.83 | – | 33 | – | – | – | – |
| Zhong et al. | 2020 | 1.16(1) | 0.79 | – | 7565 | -0.201 | – | – | – |
| Cantat-Gaudin & Anders | 2020 | 1.16 | – | – | – | – | – | – | – |
| Bossini et al. | 2019 | 1.13 | 0.66 | – | 26 | 0.000 | – | – | – |
| Soubiran et al. | 2018 | 1.16 | – | – | – | – | – | – | – |
| Cantat-Gaudin et al. | 2018 | 1.16 | – | – | – | – | – | – | – |
| Dib et al. | 2018 | 1.20 | – | – | 37 | – | – | – | – |
| Loktin & Popova | 2017 | 1.33 | 0.71 | – | 28 | – | – | – | – |
| Joshi et al. | 2016 | 1.20 | 0.79 | – | 37 | – | 309 | – | – |
| Dias et al. | 2016 | 1.33 | 0.69 | – | 25 | – | – | – | – |
| Kharchenko et al. | 2016 | 1.20 | 0.79 | – | 37 | – | – | – | – |
| Kharchenko et al. | 2013 | 1.20 | 0.79 | – | 37 | – | – | – | – |
| Bukowiecki et al. | 2012 | – | – | – | – | – | 1270 | – | – |
| Gozha et al. | 2012 | 1.33 | – | – | 25 | – | 309 | – | – |
| Kharchenko et al. | 2012 | 1.20 | 0.79 | – | 37 | – | – | – | – |
| Bukowiecki et al. | 2011 | 1.16(1) | 0.66 | – | 22 | – | – | – | – |
| Kharchenko et al. | 2009 | 1.32 | 0.69 | – | 42 | – | – | – | – |
| Piskunov et al. | 2008 | 1.32 | 0.69 | – | 42 | – | 746(1) | – | – |
| Piskunov et al. | 2007 | 1.32 | 0.69 | – | 42 | – | 191 | – | – |
| Ahumada & Lapasset | 2007 | – | 0.69 | – | 30 | – | – | – | 0 |
| van den Bergh | 2006 | 1.32 | 0.69 | – | 30 | – | – | – | – |
| Kharchenko et al. | 2005 | 1.32 | 0.69 | – | 42 | – | – | – | – |
| Kharchenko et al. | 2003 | 0.72 | 0.69 | – | – | – | – | – | – |
| Chen et al. | 2003 | 1.32 | – | – | 20 | – | – | – | – |
| Dias et al. | 2002 | 1.32 | 0.70 | – | 29 | – | – | – | – |
| Dambis | 1999 | 1.10 | 0.73 | – | 16 | – | – | – | – |
| Lynga | 1987 | 1.27 | 0.66 | – | 25 | – | – | – | – |
| Alter et al. | 1970 | 1.27 | – | – | – | – | – | – | – |
(N): Indicates that there are N extra values assigned to this parameter in the corresponding reference.
Li et al. (2026)
Tidal & Core radii: r_t=14+/-5.8 [pc], r_c=0.82+/-0.1 [pc]; stars within r_t: N~360
Almeida et al. (2025)
Mass determination: intermediate fit. Isochrone match: good fit. Silver sample.
Cavallo et al. (2024)
Gold sample.
Hunt & Reffert (2024)
Classified as open cluster. CMD class: 1.00 (50th percentile).
Hunt & Reffert (2023)
Classified as open cluster. CMD class: 1.00 (50th percentile).
Hu et al. (2021)
Ellipticities (core, all): e_core=0.103, e_all=0.1435.
Rain et al. (2021)
This cluster was include in (Dias et al., 2002A&A...389..871D, Cat. B/ocl) however, parameters log(t)=7.408, Av=0.657, [Fe/H]= 0.00 were taken from Bossini et al. (2019A&A...623A.108B, Cat. J/A+A/623/A108).