Melotte 111
(Collinder 256; Com Mov Cl; Coma Ber; MWSC 2020; Coma Star; Coma Berenices; OCL 558)
0.80
UTI
0.77
CN
0.24
Cdens
1.0
CC3
1.0
Clit
1.0
Cdup
Nm (P>50%)
150
Core radius and density
4.3 [pc], 1.2 [pc-2]
- CN 0.77 Rich
- Cdens 0.24 Very loose
- CC3 1.0 Very high quality
- Clit 1.0 Very well-studied
- Cdup 1.0 Unique
 MOCA
MOCA
Overview
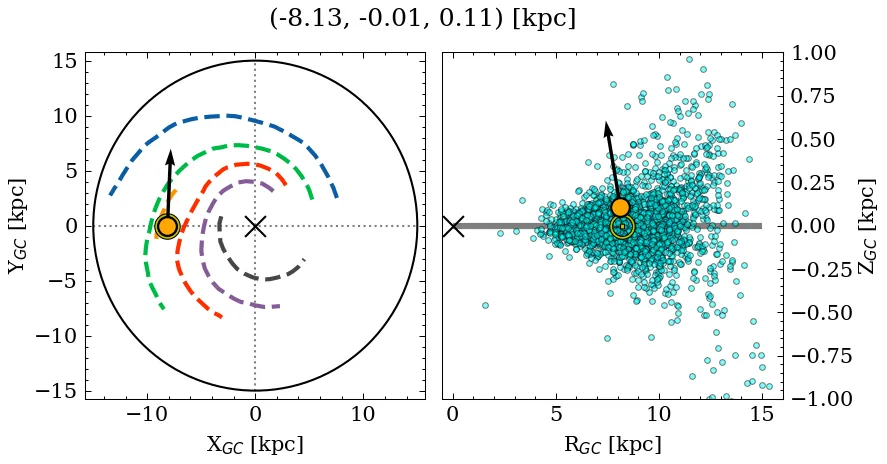
Melotte 111 is a rich, very loose object of very high C3 quality. Its parallax locates it at a very close distance, above the mid-plane, affected by low extinction. It is catalogued as a near-solar metallicity, intermediate-age cluster, but with a large variance across recent sources for the absorption parameter (see Parameters). It is very well-studied in the literature.
Data
| Reference | Year | RA [deg] | DEC [deg] | Plx [mas] | pmRA [mas/yr] | pmDE [mas/yr] | Rv [km/s] |
|---|---|---|---|---|---|---|---|
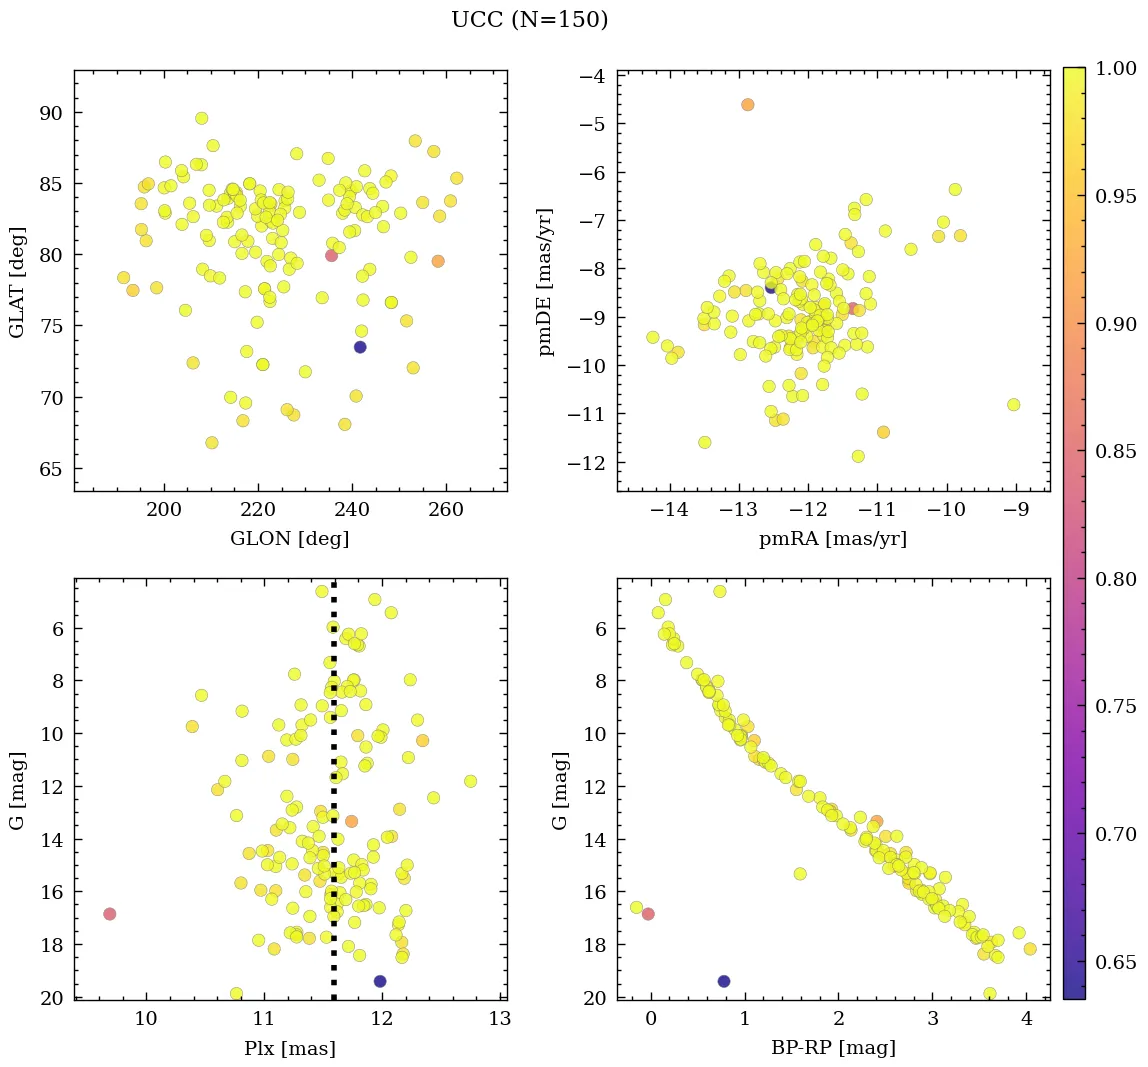
| UCC | 99999– | 185.06 | 25.478 | 11.593 | -12.038 | -9.002 | 0.38 |
| Yan et al. | 2026 | 186.017 | 26.423 | 11.709 | -12.155 | -8.855 | – |
| Malhotra et al. | 2026 | 182.979 | 25.277 | – | – | – | – |
| Otto et al. | 2026 | 186.017 | 26.423 | – | -12.03 | -8.97 | 0.4 |
| Li et al. | 2025 | 186.014 | 25.652 | 11.595 | -12.03 | -8.973 | – |
| Yang et al. | 2025 | 186.017 | 26.423 | – | – | – | – |
| Qin et al. | 2025 | 186.017 | 26.423 | – | – | – | – |
| Almeida et al. | 2025 | 186.304 | 25.368 | – | – | – | – |
| Zhang et al. | 2024 | 186.017 | 26.423 | – | – | – | – |
| Hunt & Reffert | 2024 | 186.017 | 26.423 | 11.709 | -12.155 | -8.855 | -0.173 |
| Cavallo et al. | 2024 | 186.718 | 25.899 | 11.698 | – | – | – |
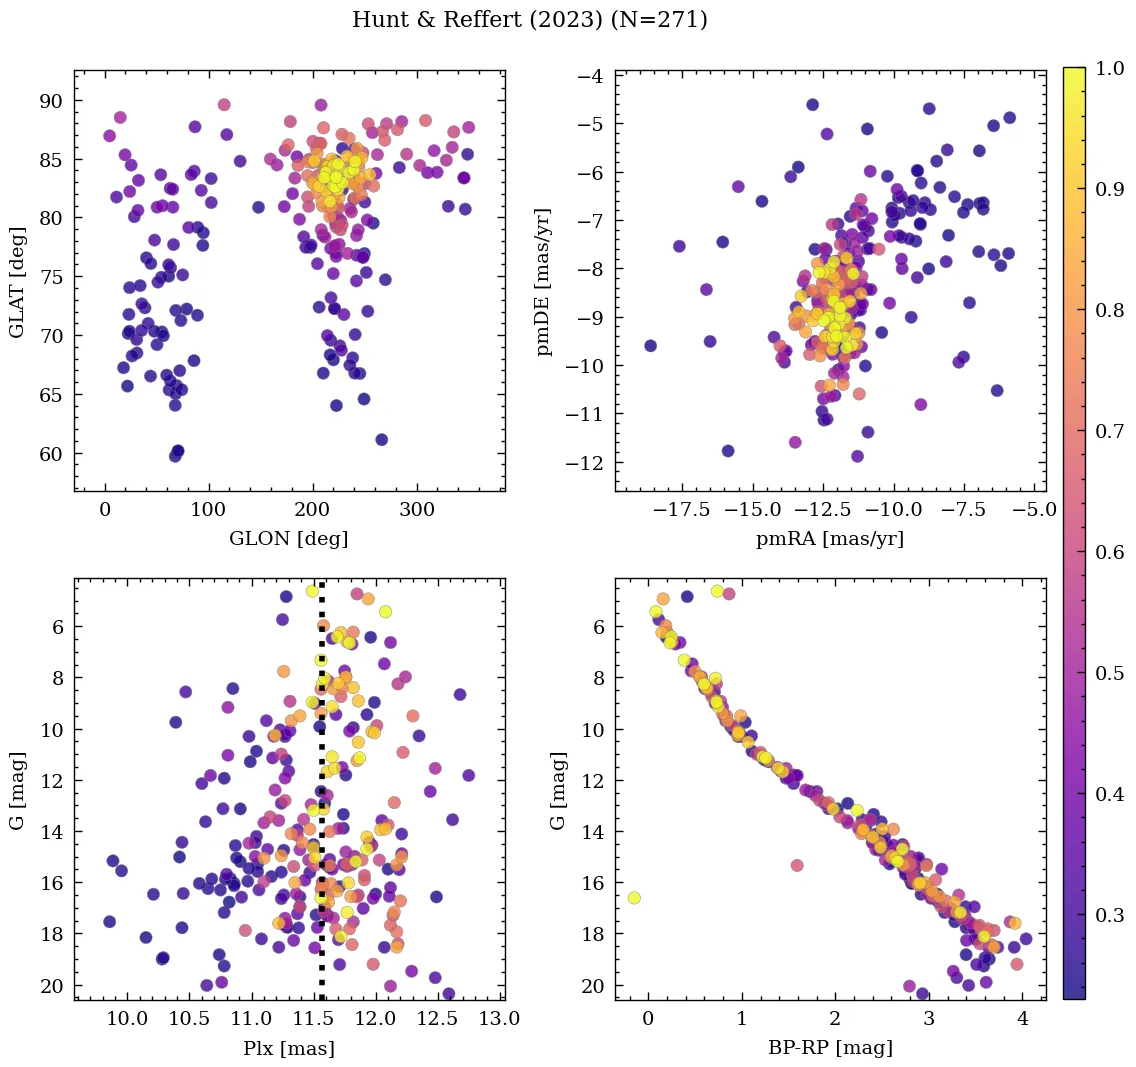
| Hunt & Reffert | 2023 | 186.017 | 26.423 | 11.709 | -12.155 | -8.855 | -0.173 |
| He et al. | 2022 | 185.59 | 25.839 | 11.665 | -12.106 | -8.951 | – |
| Fu et al. | 2022 | 186.014 | 25.652 | – | – | – | -4.338 |
| Tarricq et al. | 2022 | 186.181 | 26.154 | 11.652 | -11.996 | -8.763 | – |
| Jadhav & Subramaniam | 2021 | 186.014 | 25.652 | – | – | – | – |
| Jaehnig et al. | 2021 | 186.175 | 25.766 | 11.616 | -12.036 | -8.916 | – |
| Netopil et al. | 2022 | 186.275 | 26.1 | – | – | – | -0.06 |
| Dias et al. | 2021 | 186.304 | 25.368 | 11.582 | -12.02 | -8.909 | 0.124 |
| Spina et al. | 2021 | 186.035 | 25.701 | 11.595 | -12.027 | -8.979 | – |
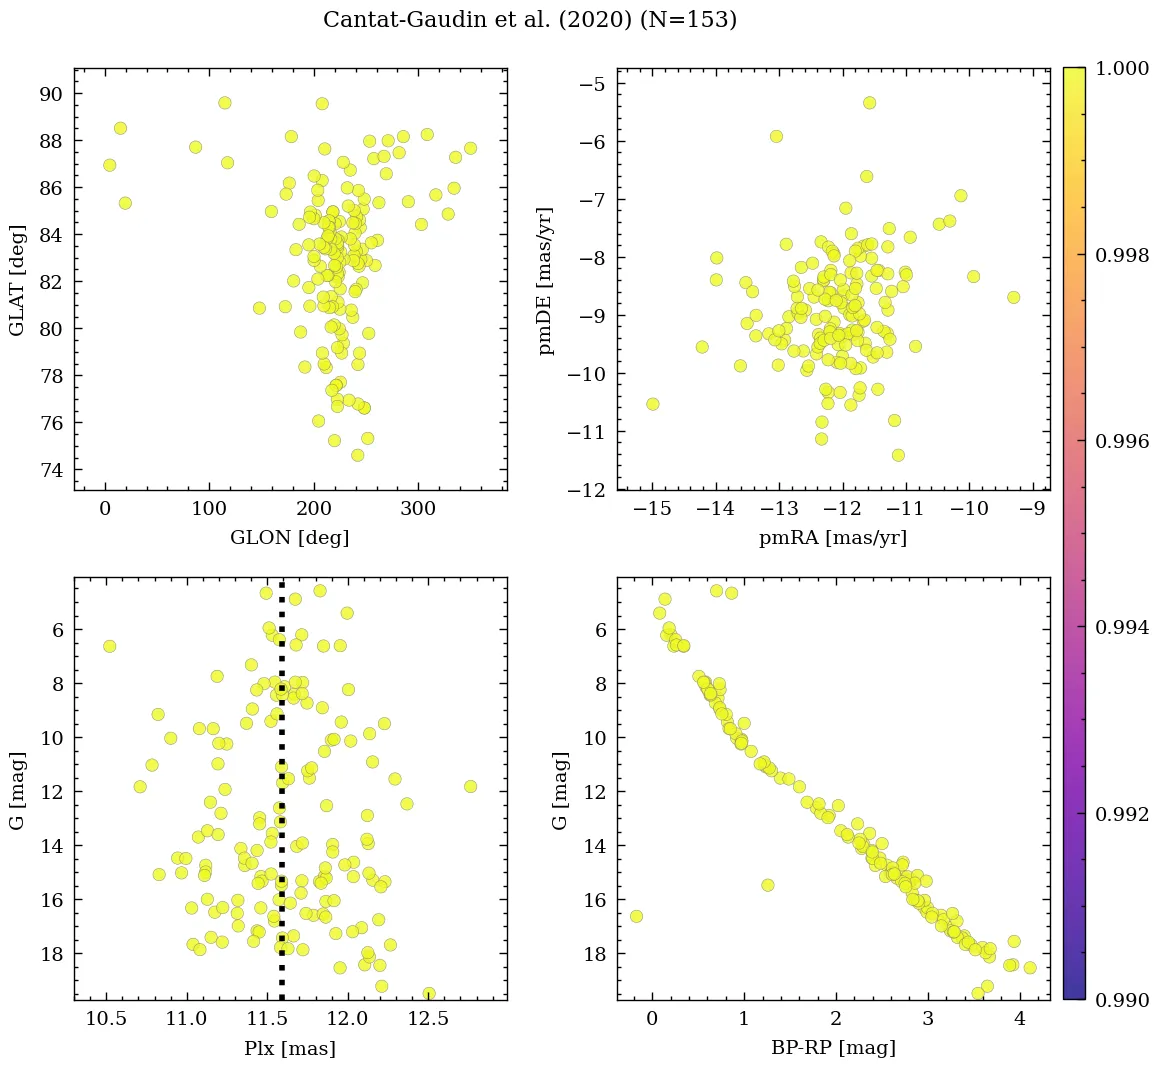
| Cantat-Gaudin et al. | 2020 | 186.014 | 25.652 | 11.595 | -12.03 | -8.973 | – |
| Bica et al. | 2019 | 186.268 | 26.105 | – | – | – | – |
| Yen et al. | 2018 | 186.099 | 25.957 | 11.55 | -12.22 | -9.01 | – |
| Dib et al. | 2018 | 185.985 | 26.3 | – | – | – | – |
| Loktin & Popova | 2017 | 186.27 | 26.1 | – | -6.78 | -3.41 | -1.0 |
| Sampedro et al. | 2017 | 186.275 | 26.1 | – | -7.25 | -3.91 | – |
| Joshi et al. | 2016 | 185.985 | 26.3 | – | – | – | – |
| Dias et al. | 2016 | 186.275 | 26.1 | – | -6.78 | -3.41 | 0.01 |
| Kharchenko et al. | 2016 | 185.978 | 26.303 | – | – | – | – |
| Netopil et al. | 2016 | 186.275 | 26.1 | – | – | – | – |
| Dias et al. | 2014 | 186.275 | 26.1 | – | -6.52 | -3.08 | – |
| Kharchenko et al. | 2013 | 185.985 | 26.3 | – | -11.72 | -8.76 | -1.0 |
| Gozha et al. | 2012 | 186.275 | 26.1 | – | – | – | – |
| Kharchenko et al. | 2009 | 185.623 | 25.854 | – | – | – | – |
| Piskunov et al. | 2008 | 185.623 | 25.854 | – | – | – | – |
| Kharchenko et al. | 2007 | 186.27 | 26.1 | – | 4.0 | – | -0.87 |
| Piskunov et al. | 2007 | 185.623 | 25.854 | – | – | – | – |
| Ahumada & Lapasset | 2007 | 186.275 | 26.1 | – | – | – | – |
| van den Bergh | 2006 | 185.625 | 25.85 | – | – | – | – |
| Kharchenko et al. | 2005 | 185.62 | 25.85 | – | -11.45 | -8.98 | -1.17 |
| Kharchenko et al. | 2003 | 185.62 | 25.85 | – | -11.03 | -9.0 | – |
| Chen et al. | 2003 | 186.27 | 26.099 | – | -11.38 | -9.05 | -0.1 |
| Dias et al. | 2002 | 186.275 | 26.1 | – | -10.84 | -3.2 | – |
| Lynga | 1987 | 186.255 | 26.113 | – | – | – | 0.0 |
| Alter et al. | 1970 | 186.255 | 26.113 | – | – | – | – |
💡 Note: The UCC values are estimated from its identified members.
| Reference | Year | Dist [kpc] | Av [mag] | DAv [mag] | Age [Myr] | [Fe/H] [dex] | Mass [Msun] | Bfrac | BSS |
|---|---|---|---|---|---|---|---|---|---|
| UCC | 99999– | 0.09 | 0.03 | 0.44 | 619 | 0.000 | 256 | – | 0 |
| Yan et al. | 2026 | – | – | – | 645 | – | – | – | – |
| Malhotra et al. | 2026 | 0.09 | 0.03 | – | 622 | -0.050 | – | – | – |
| Otto et al. | 2026 | – | – | – | 646 | -0.010(15) | – | – | – |
| Li et al. | 2025 | 0.10 | 0.26 | – | 604 | 0.066 | – | – | – |
| Yang et al. | 2025 | – | – | – | 661 | -0.060(3) | – | – | – |
| Qin et al. | 2025 | – | – | – | 654(1) | – | – | – | – |
| Almeida et al. | 2025 | 0.09 | 0.15 | – | 619 | – | 51 | – | – |
| Zhang et al. | 2024 | – | – | – | – | 0.062(1) | – | – | – |
| Hunt & Reffert | 2024 | 0.09 | 0.07 | 0.44 | 654 | – | 49(1) | – | – |
| Cavallo et al. | 2024 | 0.09 | 0.29 | – | 295 | 0.200 | – | – | – |
| Hunt & Reffert | 2023 | 0.09 | 0.07 | 0.44 | 655 | – | – | – | – |
| He et al. | 2022 | – | 0.35 | – | 562 | – | – | – | – |
| Fu et al. | 2022 | – | – | – | – | 0.078 | – | – | – |
| Spina et al. | 2022 | – | – | – | – | 0.002 | – | – | – |
| Tarricq et al. | 2022 | 0.09 | – | – | 646 | – | – | – | – |
| Jadhav & Subramaniam | 2021 | 0.09 | 0.00 | – | 646 | – | 267 | – | 0(1) |
| Jaehnig et al. | 2021 | 0.09(1) | – | – | – | – | – | – | – |
| Netopil et al. | 2022 | 0.09(1) | – | – | 708 | -0.010(1) | – | – | – |
| Dias et al. | 2021 | 0.09 | 0.15 | – | 619 | -0.060 | – | – | – |
| Spina et al. | 2021 | 0.09 | – | – | 646 | -0.002(20) | – | – | – |
| Cantat-Gaudin et al. | 2020 | 0.09 | 0.00 | – | 646 | – | – | – | – |
| Yen et al. | 2018 | 0.09 | 0.17 | – | 562 | – | – | – | – |
| Dib et al. | 2018 | 0.09 | – | – | 692 | – | – | – | – |
| Loktin & Popova | 2017 | 0.10 | 0.04 | – | 449 | – | – | – | – |
| Joshi et al. | 2016 | 0.09 | 0.00 | – | 692 | – | – | – | – |
| Dias et al. | 2016 | 0.10 | 0.04 | – | 449 | 0.070 | – | – | – |
| Kharchenko et al. | 2016 | 0.09 | 0.00 | – | 692 | – | – | – | – |
| Netopil et al. | 2016 | 8.01 | – | – | 570 | 0.000(2) | – | – | – |
| Heiter et al. | 2014 | – | – | – | – | 0.000 | – | – | – |
| Kharchenko et al. | 2013 | 0.09 | 0.00 | – | 692 | 0.070 | – | – | – |
| Gozha et al. | 2012 | 0.10 | – | – | 449 | 0.020 | 331 | – | – |
| Paunzen et al. | 2010 | – | – | – | – | -0.030 | – | – | – |
| Kharchenko et al. | 2009 | 0.09 | 0.00 | – | 603 | – | – | – | – |
| Piskunov et al. | 2008 | 0.09 | 0.00 | – | 603 | – | 317(1) | – | – |
| Piskunov et al. | 2007 | 0.09 | 0.00 | – | 603 | – | 246 | – | – |
| Ahumada & Lapasset | 2007 | – | 0.03 | – | 447 | – | – | – | 1 |
| van den Bergh | 2006 | 0.10 | 0.03 | – | 447 | – | – | – | – |
| Kharchenko et al. | 2005 | 0.09 | 0.00 | – | 603 | – | – | – | – |
| Kharchenko et al. | 2003 | 0.09 | 0.03 | – | – | – | – | – | – |
| Chen et al. | 2003 | 0.10 | 0.04 | – | 440 | -0.050(1) | – | – | – |
| Dias et al. | 2002 | 0.10 | 0.04 | – | 449 | – | – | – | – |
| Lynga | 1987 | 0.09 | 0.00 | – | 398 | -0.030 | – | – | – |
| Alter et al. | 1970 | 0.08 | – | – | – | – | – | – | – |
(N): Indicates that there are N extra values assigned to this parameter in the corresponding reference.
Malhotra et al. (2026)
Lowest/Highest stellar mass in the catalogue with a mass-ratio estimate: 0.12/2.17 Msun
Yan et al. (2026)
Number of WDs: expected from single-star evolution N=8, with probability of formation through binary evolution >=0.5 N=1.
Palma et al. (2025)
Classified as optical pair (not dynamically associated) P130, along with HSC_1537.
Almeida et al. (2025)
Mass determination: worst fit. Isochrone match: good fit.
Cavallo et al. (2024)
Gold sample.
Hunt & Reffert (2024)
Classified as open cluster. CMD class: 0.99 (50th percentile).
Hunt & Reffert (2023)
Classified as open cluster. CMD class: 0.99 (50th percentile).
Ahumada & Lapasset (2007)
= Coma cluster. Adopted cluster centre: star 91 in (1938LicOB..18..167T). Star 146 = 17 Comae = HD 108662 = AI Comae is a cluster member (1938LicOB..18..167T) and an Alpha Canum Venaticorum variable (1982A&A...109...37M). It is cited as a blue straggler by (1985ApJ...294L.103A), (1977IBVS.1293....1H), and (1982A&A...109...37M). Reference (1985ApJ...294L.103A) gives this star a projected velocity v.sin i=15km/s and a spectrum A0Vp(Sr,Cr,Si,Eu).