Hogg 16
(MWSC 2123)
0.81
UTI
0.48
CN
0.8
Cdens
0.75
CC3
1.0
Clit
1.0
Cdup
Stellar density (N50/rad)
4.0 [N/pc2]
- CN 0.48 Poorly populated
- Cdens 0.8 Dense
- CC3 0.75 High quality
- Clit 1.0 Very well-studied
- Cdup 1.0 Unique
 MOCA
MOCA
Overview
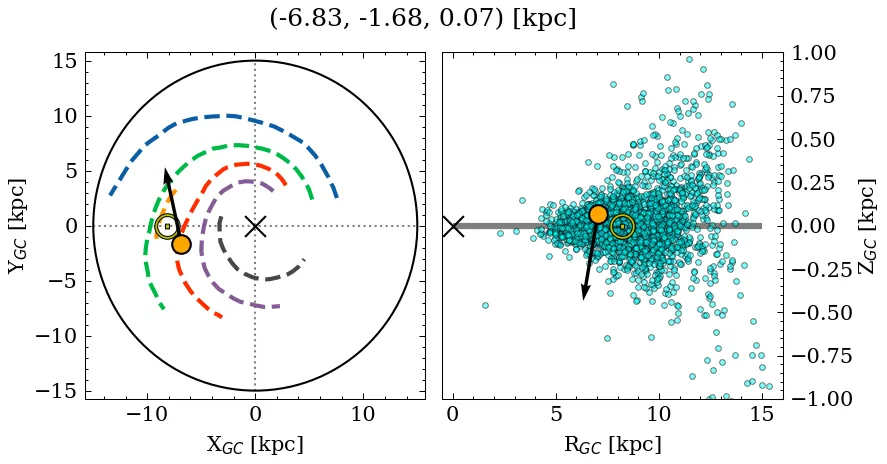
Hogg 16 is a poorly populated, dense object of high C3 quality. Its parallax locates it at a moderate* distance, above the mid-plane, affected by moderate extinction. It is catalogued as a near-solar metallicity, young cluster (see Parameters). It is very well-studied in the literature.
(*): The parallax distance estimate (~2.21 kpc) differs significantly from the median photometric distance (~1.59 kpc).
Note: This object shares a large percentage of members with a later reported entry. See table with shared members information.
Data
| Reference | Year | RA [deg] | DEC [deg] | Plx [mas] | pmRA [mas/yr] | pmDE [mas/yr] | Rv [km/s] |
|---|---|---|---|---|---|---|---|
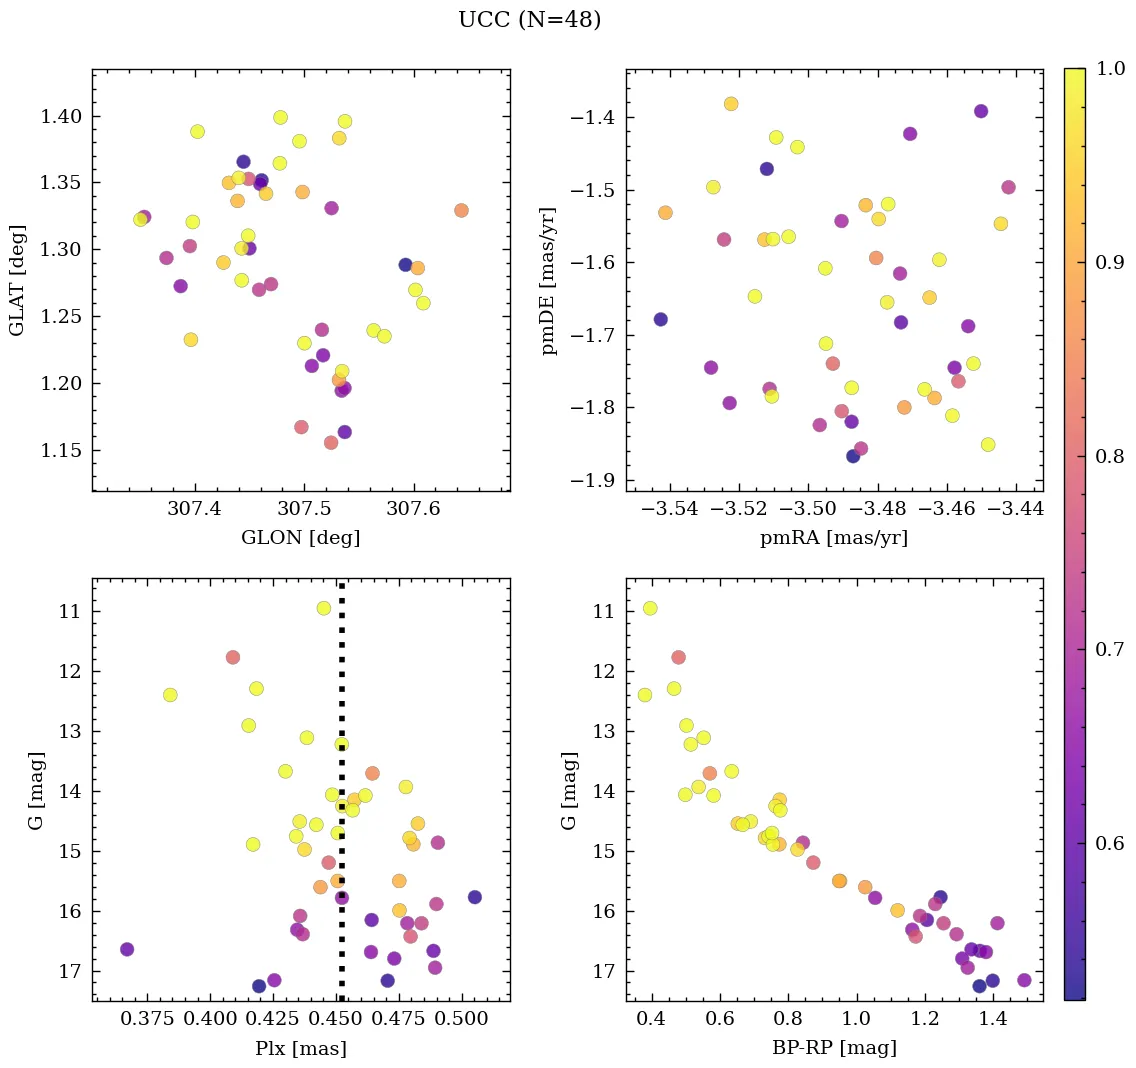
| UCC | 99999– | 202.323 | -61.241 | 0.452 | -3.487 | -1.652 | -75.218 |
| Li et al. | 2025 | 202.3 | -61.209 | 0.431 | -3.479 | -1.645 | – |
| Almeida et al. | 2025 | 202.3 | -61.209 | – | – | – | – |
| Almeida et al. | 2023 | 202.306 | -61.209 | – | – | – | – |
| Just et al. | 2023 | 202.309 | -61.209 | – | – | – | – |
| Jaehnig et al. | 2021 | 202.485 | -61.284 | 0.454 | -3.455 | -1.809 | – |
| Dias et al. | 2021 | 202.3 | -61.209 | 0.431 | -3.479 | -1.645 | – |
| Loktin & Popova | 2017 | 202.32 | -61.2 | – | -6.414 | -0.718 | -33.0 |
| Kharchenko et al. | 2016 | 202.309 | -61.209 | – | – | – | – |
| Dias et al. | 2014 | 202.325 | -61.2 | – | -6.26 | -1.51 | – |
| Kharchenko et al. | 2013 | 202.32 | -61.212 | – | -4.53 | -1.82 | -33.0 |
| Morales et al. | 2013 | 202.325 | -61.2 | – | – | – | – |
| Gozha et al. | 2012 | 202.325 | -61.2 | – | – | – | – |
| Piskunov et al. | 2008 | 202.309 | -61.198 | – | – | – | – |
| Kharchenko et al. | 2007 | 202.32 | -61.2 | – | 0.09 | – | -33.0 |
| van den Bergh | 2006 | 202.325 | -61.2 | – | – | – | – |
| Kharchenko et al. | 2005 | 202.32 | -61.2 | – | -4.68 | -1.54 | -36.25 |
| Kharchenko et al. | 2003 | 202.32 | -61.2 | – | -4.9 | -1.29 | – |
| Chen et al. | 2003 | 202.383 | -61.233 | – | -3.71 | -3.17 | -35.8 |
| Dias et al. | 2002 | 202.325 | -61.2 | – | -3.71 | -3.17 | -30.83 |
| Dambis | 1999 | 202.325 | -61.2 | – | – | – | – |
💡 Note: The UCC values are estimated from its identified members.
| Reference | Year | Dist [kpc] | Av [mag] | DAv [mag] | Age [Myr] | [Fe/H] [dex] | Mass [Msun] | Bfrac | BSS |
|---|---|---|---|---|---|---|---|---|---|
| UCC | 99999– | 1.59 | 1.27 | – | 24 | 0.110 | 208 | 0.65 | – |
| Li et al. | 2025 | 1.84 | 1.42 | – | 36 | -0.138 | – | – | – |
| Almeida et al. | 2025 | 1.94 | 1.42 | – | 31 | – | 185 | – | – |
| Almeida et al. | 2023 | 2.00 | 1.49 | – | 26 | 0.119 | 232(1) | 0.65 | – |
| Just et al. | 2023 | – | – | – | 89 | – | 413 | – | – |
| Jaehnig et al. | 2021 | 2.22(1) | – | – | – | – | – | – | – |
| Dias et al. | 2021 | 1.94 | 1.42 | – | 31 | 0.110 | – | – | – |
| Loktin & Popova | 2017 | 1.45 | 1.55 | – | 23 | – | – | – | – |
| Kharchenko et al. | 2016 | 2.06 | 1.27 | – | 89 | – | – | – | – |
| Kharchenko et al. | 2013 | 2.06 | 1.27 | – | 89 | – | – | – | – |
| Morales et al. | 2013 | 1.59 | – | – | 11 | – | – | – | – |
| Gozha et al. | 2012 | 1.58 | – | – | 11 | – | 29 | – | – |
| Piskunov et al. | 2008 | 1.58 | 1.27 | – | 18 | – | – | – | – |
| van den Bergh | 2006 | 1.58 | 1.27 | – | 11 | – | – | – | – |
| Kharchenko et al. | 2005 | 1.58 | 1.27 | – | 18 | – | – | – | – |
| Kharchenko et al. | 2003 | 1.58 | 1.08 | – | – | – | – | – | – |
| Chen et al. | 2003 | 1.58 | – | – | 10 | – | – | – | – |
| Dias et al. | 2002 | 1.58 | 1.27 | – | 11 | – | – | – | – |
| Dambis | 1999 | 1.91 | 1.39 | – | 25 | – | – | – | – |
(N): Indicates that there are N extra values assigned to this parameter in the corresponding reference.
Morales et al. (2013)
Classified as morphological type 'OC2' (totally exposed cluster without correlation with ATLASGAL emission). Morphological flag: exposed cluster, without submm emission.
Almeida et al. (2025)
Mass determination: good fit. Isochrone match: good fit. Silver sample.