FSR 1530
(MWSC 1774)
0.49
UTI
0.48
CN
0.13
Cdens
0.75
CC3
0.55
Clit
1.0
Cdup
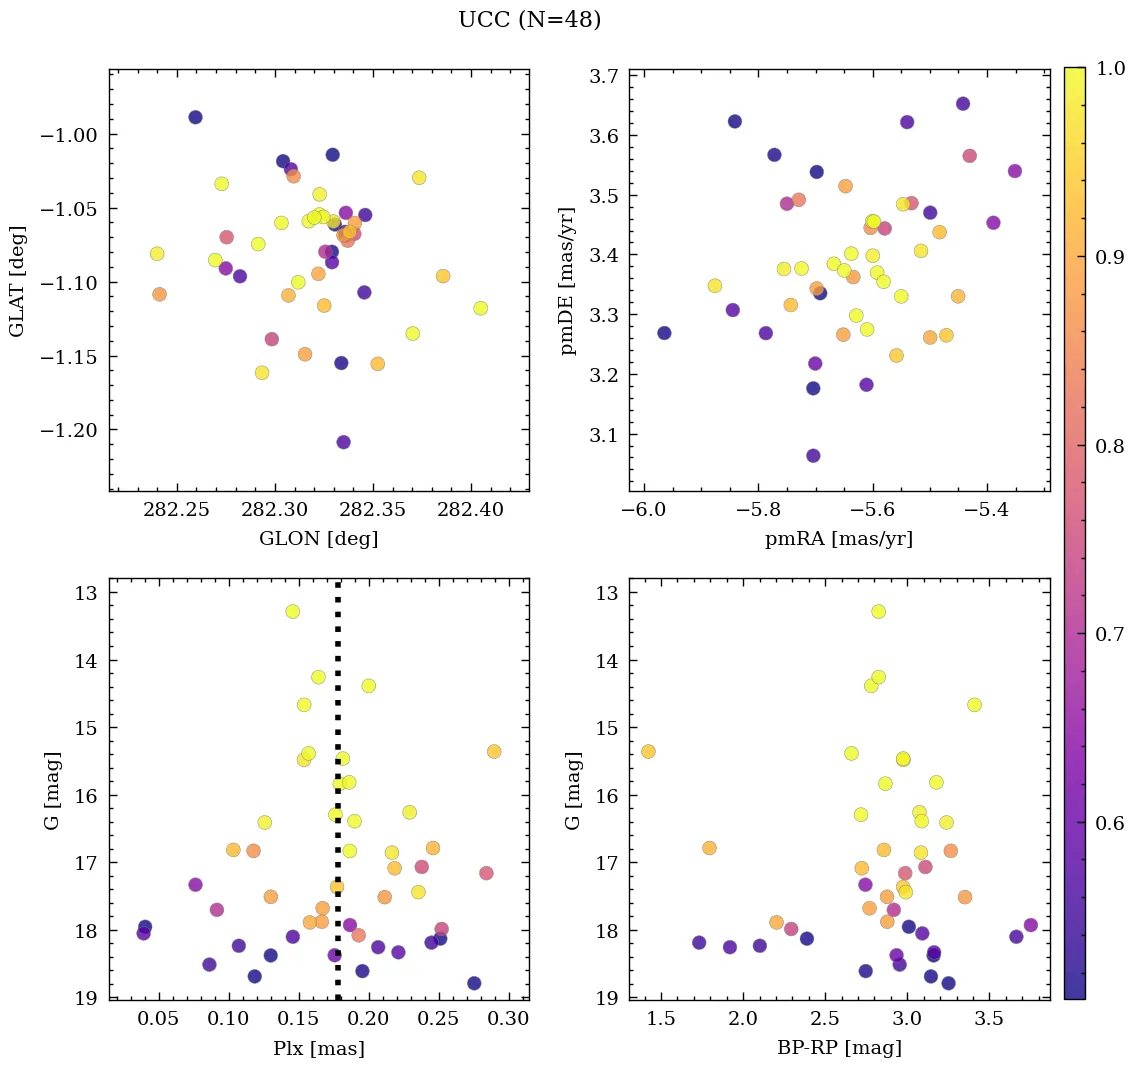
Nm (P>50%)
48
Core radius and density
3.2 [pc], 0.7 [pc-2]
- CN 0.48 Poorly populated
- Cdens 0.13 Very loose
- CC3 0.75 High quality
- Clit 0.55 Moderately studied
- Cdup 1.0 Unique
 MOCA
MOCA
Overview
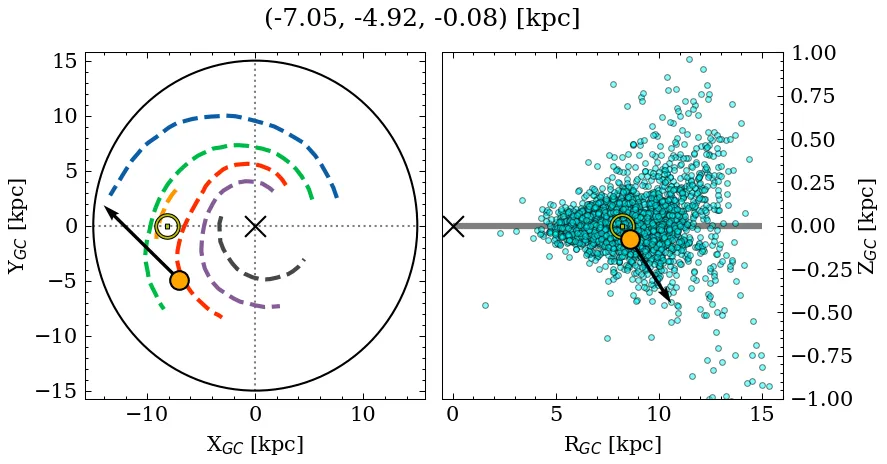
FSR 1530 is a poorly populated, very loose object of high C3 quality. Its parallax locates it at a large distance, below the mid-plane, affected by high extinction. It is catalogued as a massive, intermediate-age cluster, but with a large variance across recent sources for the age and mass parameters (see Parameters). It is moderately studied in the literature.
Note: This object contains blue stragglers according to at least one source.
Data
| Reference | Year | RA [deg] | DEC [deg] | Plx [mas] | pmRA [mas/yr] | pmDE [mas/yr] | Rv [km/s] |
|---|---|---|---|---|---|---|---|
| UCC | 99999– | 152.226 | -57.29 | 0.178 | -5.62 | 3.376 | 100.165 |
| Li et al. | 2026 | 152.22 | -57.33 | – | – | – | – |
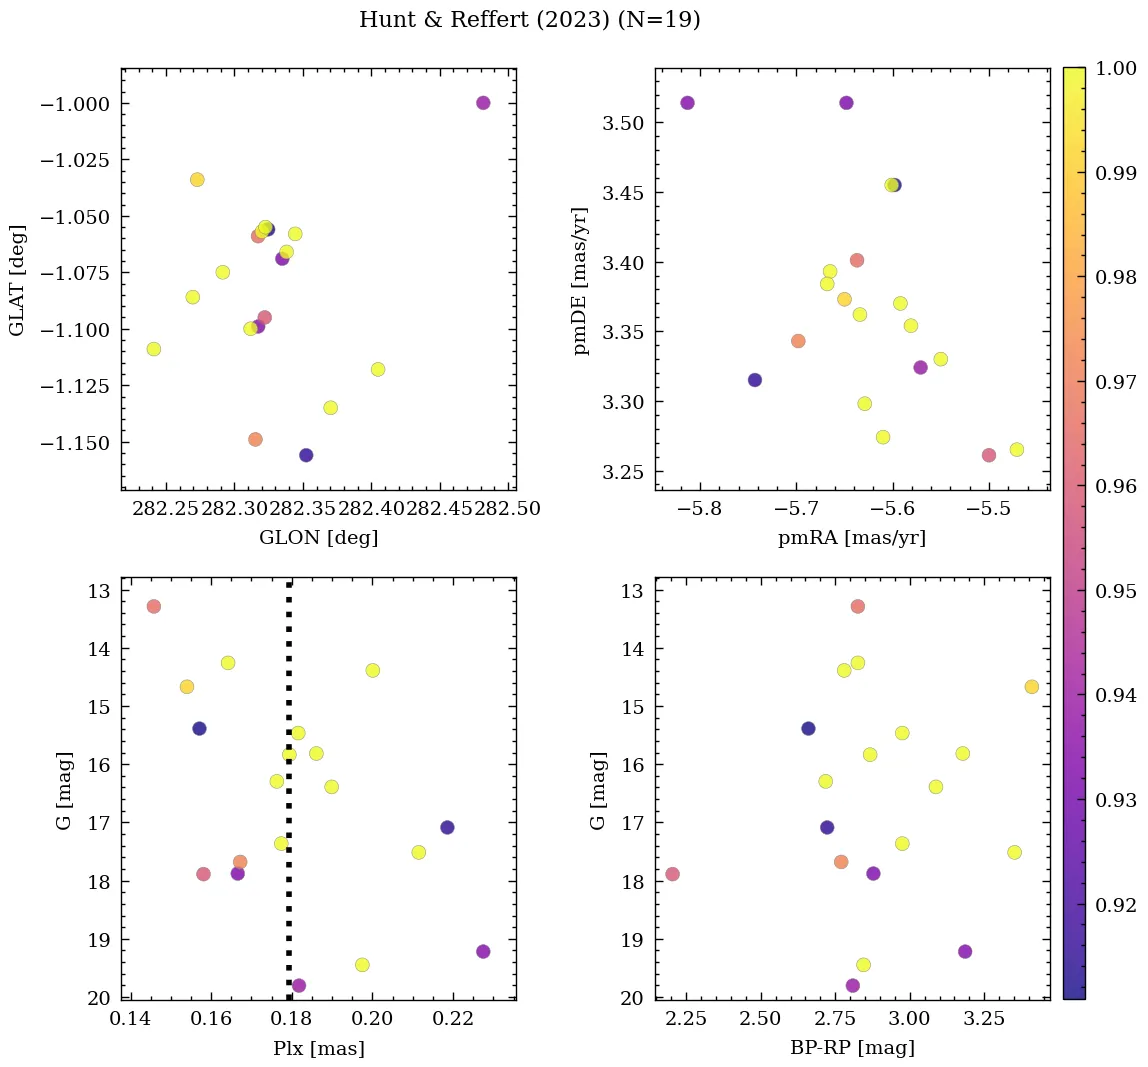
| Hunt & Reffert | 2024 | 152.242 | -57.282 | 0.177 | -5.618 | 3.386 | 180.291 |
| Hunt & Reffert | 2023 | 152.242 | -57.282 | 0.177 | -5.618 | 3.386 | 180.291 |
| Just et al. | 2023 | 152.237 | -57.282 | – | – | – | – |
| Jadhav & Subramaniam | 2021 | 152.216 | -57.288 | – | – | – | – |
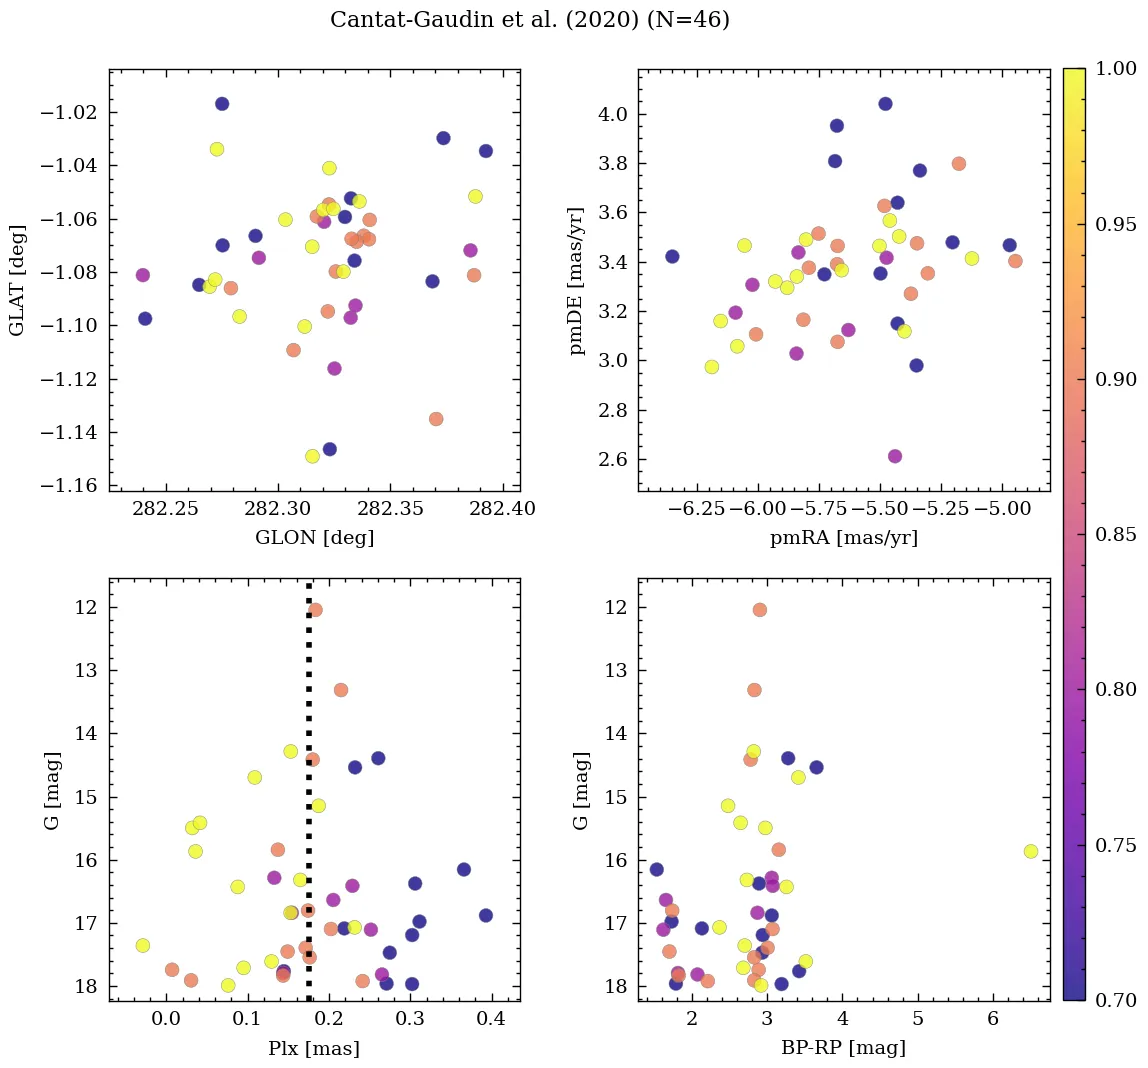
| Cantat-Gaudin et al. | 2020 | 152.216 | -57.288 | 0.196 | -5.661 | 3.373 | – |
| Cantat-Gaudin & Anders | 2020 | 152.216 | -57.288 | 0.196 | -5.661 | 3.373 | – |
| Soubiran et al. | 2018 | 152.216 | -57.288 | – | – | – | -21.14 |
| Cantat-Gaudin et al. | 2018 | 152.216 | -57.288 | 0.196 | -5.661 | 3.373 | – |
| Kharchenko et al. | 2016 | 152.237 | -57.282 | – | – | – | – |
| Kharchenko et al. | 2013 | 152.242 | -57.285 | – | -1.47 | 5.19 | – |
| Froebrich et al. | 2007 | 152.254 | -57.295 | – | – | – | – |
💡 Note: The UCC values are estimated from its identified members.
| Reference | Year | Dist [kpc] | Av [mag] | DAv [mag] | Age [Myr] | [Fe/H] [dex] | Mass [Msun] | Bfrac | BSS |
|---|---|---|---|---|---|---|---|---|---|
| UCC | 99999– | 4.45 | 3.9 | 2.09 | 631 | – | 1723 | – | 7 |
| Hunt & Reffert | 2024 | 5.74 | 6.70 | 2.09 | 45 | – | 1723(1) | – | – |
| Hunt & Reffert | 2023 | 5.74 | 6.70 | 2.09 | 45 | – | – | – | – |
| Just et al. | 2023 | – | – | – | 631 | – | 622 | – | – |
| Jadhav & Subramaniam | 2021 | 5.42 | 3.90 | – | 1072 | – | 4755 | – | 7(1) |
| Cantat-Gaudin et al. | 2020 | 5.42 | 3.90 | – | 1072 | – | – | – | – |
| Kounkel et al. | 2020 | 4.40 | 3.70 | – | 617 | – | – | – | – |
| Cantat-Gaudin & Anders | 2020 | 4.45 | – | – | – | – | – | – | – |
| Soubiran et al. | 2018 | 4.45 | – | – | – | – | – | – | – |
| Cantat-Gaudin et al. | 2018 | 4.45 | – | – | – | – | – | – | – |
| Kharchenko et al. | 2016 | 4.15 | 3.02 | – | 631 | – | – | – | – |
| Kharchenko et al. | 2013 | 4.15 | 3.02 | – | 631 | – | – | – | – |
(N): Indicates that there are N extra values assigned to this parameter in the corresponding reference.
Li et al. (2026)
Tidal & Core radii: r_t=112+/-66.0 [pc], r_c=0.72+/-0.0 [pc]; stars within r_t: N~157
Hunt & Reffert (2024)
Classified as open cluster. CMD class: 0.14 (50th percentile).
Hunt & Reffert (2023)
Classified as open cluster. CMD class: 0.14 (50th percentile).
Hu et al. (2021)
Ellipticities (core, all): e_core=0.2308, e_all=0.1377.