FSR 0413
(MWSC 3687)
0.20
UTI
0.0
CN
0.27
Cdens
0.12
CC3
0.31
Clit
1.0
Cdup
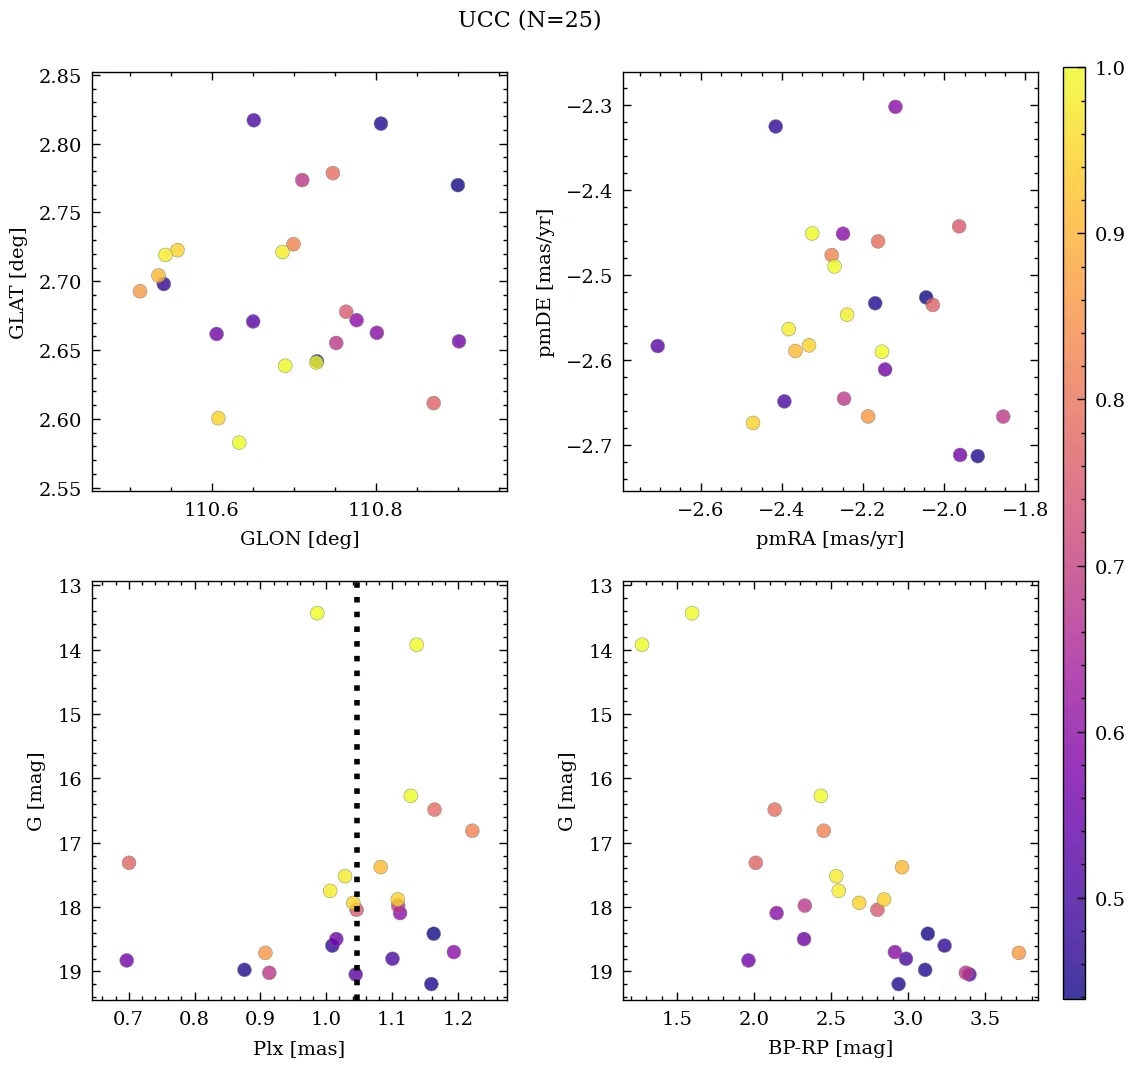
Nm (P>50%)
21
Core radius and density
1.5 [pc], 1.3 [pc-2]
- CN 0.0 Sparse
- Cdens 0.27 Loose
- CC3 0.12 Very low quality
- Clit 0.31 Poorly studied
- Cdup 1.0 Unique
 MOCA
MOCA
Overview
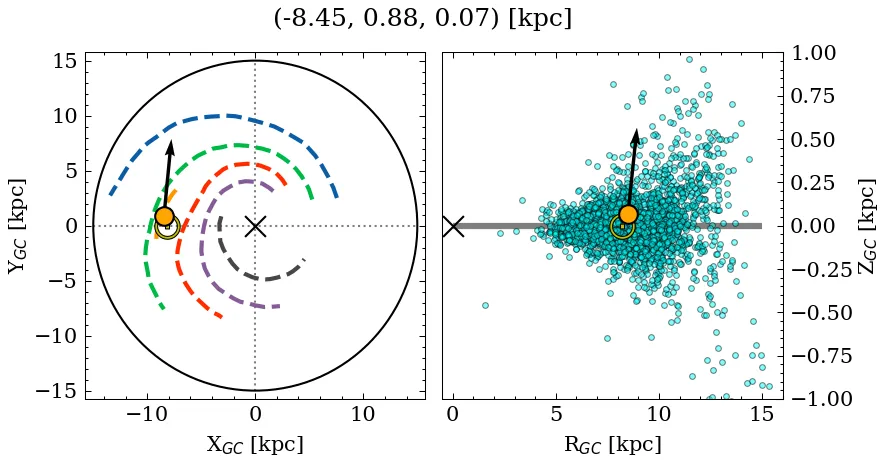
FSR 0413 is a sparse, loose object of very low C3 quality. Its parallax locates it at a close* distance, above the mid-plane, affected by high extinction. It is catalogued as a low-mass, intermediate-age cluster (see Parameters). It is poorly studied in the literature.
(*): The parallax distance estimate (~0.96 kpc) differs significantly from the median photometric distance (~1.80 kpc).
Note: This object shares a small percentage of members with a later reported entry. See table with shared members information.
Data
| Reference | Year | RA [deg] | DEC [deg] | Plx [mas] | pmRA [mas/yr] | pmDE [mas/yr] | Rv [km/s] |
|---|---|---|---|---|---|---|---|
| UCC | 99999– | 345.141 | 62.891 | 1.046 | -2.239 | -2.563 | 2.423 |
| Just et al. | 2023 | 345.202 | 62.884 | – | – | – | – |
| Joshi et al. | 2016 | 345.21 | 62.888 | – | – | – | – |
| Dias et al. | 2016 | 345.25 | 62.894 | – | -4.95 | -2.17 | – |
| Kharchenko et al. | 2016 | 345.202 | 62.884 | – | – | – | – |
| Kharchenko et al. | 2013 | 345.21 | 62.888 | – | -4.95 | -2.17 | – |
| Kharchenko et al. | 2012 | 345.21 | 62.888 | – | -4.95 | -2.17 | – |
| Froebrich et al. | 2007 | 345.25 | 62.894 | – | – | – | – |
💡 Note: The UCC values are estimated from its identified members.
| Reference | Year | Dist [kpc] | Av [mag] | DAv [mag] | Age [Myr] | [Fe/H] [dex] | Mass [Msun] | Bfrac | BSS |
|---|---|---|---|---|---|---|---|---|---|
| UCC | 99999– | 1.8 | 4.89 | – | 178 | – | 6 | – | – |
| Just et al. | 2023 | – | – | – | 178 | – | 6 | – | – |
| Joshi et al. | 2016 | 1.80 | 4.89 | – | 178 | – | – | – | – |
| Dias et al. | 2016 | 1.80 | 4.89 | – | 178 | – | – | – | – |
| Kharchenko et al. | 2016 | 1.80 | 4.89 | – | 178 | – | – | – | – |
| Kharchenko et al. | 2013 | 1.80 | 4.89 | – | 178 | – | – | – | – |
| Kharchenko et al. | 2012 | 1.80 | 4.89 | – | 178 | – | – | – | – |