DBSB 36
(DBSB2003 36; MWSC 1645)
0.55
UTI
0.36
CN
0.66
Cdens
1.0
CC3
0.38
Clit
1.0
Cdup
Nm (P>50%)
36
Core radius and density
1.5 [pc], 3.3 [pc-2]
- CN 0.36 Poorly populated
- Cdens 0.66 Moderately dense
- CC3 1.0 Very high quality
- Clit 0.38 Poorly studied
- Cdup 1.0 Unique
 MOCA
MOCA
Overview
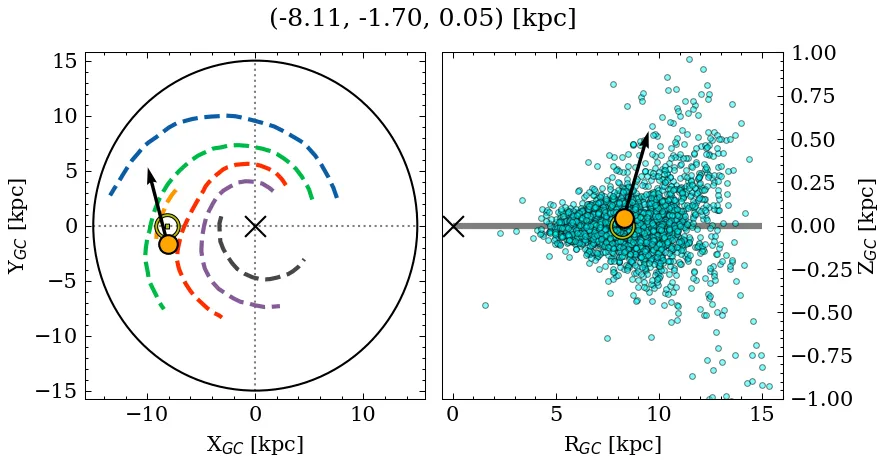
DBSB 36 is a poorly populated, moderately dense object of very high C3 quality. Its parallax locates it at a relatively close* distance, near the mid-plane, affected by very high extinction. It is catalogued as a metal-rich, young cluster, but with a large variance across recent sources for the mass parameter (see Parameters). It is poorly studied in the literature.
(*): The parallax distance estimate (~1.76 kpc) differs significantly from the median photometric distance (~1.18 kpc).
Data
| Reference | Year | RA [deg] | DEC [deg] | Plx [mas] | pmRA [mas/yr] | pmDE [mas/yr] | Rv [km/s] |
|---|---|---|---|---|---|---|---|
| UCC | 99999– | 139.193 | -47.953 | 0.569 | -5.138 | 4.219 | 93.608 |
| Hunt & Reffert | 2024 | 139.188 | -47.95 | 0.583 | -5.128 | 4.203 | 93.615 |
| Cavallo et al. | 2024 | 139.163 | -47.942 | 0.587 | – | – | – |
| Hunt & Reffert | 2023 | 139.188 | -47.95 | 0.583 | -5.128 | 4.203 | 93.615 |
| Just et al. | 2023 | 139.195 | -47.942 | – | – | – | – |
| Joshi et al. | 2016 | 139.2 | -47.945 | – | – | – | – |
| Kharchenko et al. | 2016 | 139.195 | -47.942 | – | – | – | – |
| Kharchenko et al. | 2013 | 139.2 | -47.945 | – | -5.36 | 6.99 | 21.0 |
| Dutra et al. | 2003 | 139.183 | -47.937 | – | – | – | – |
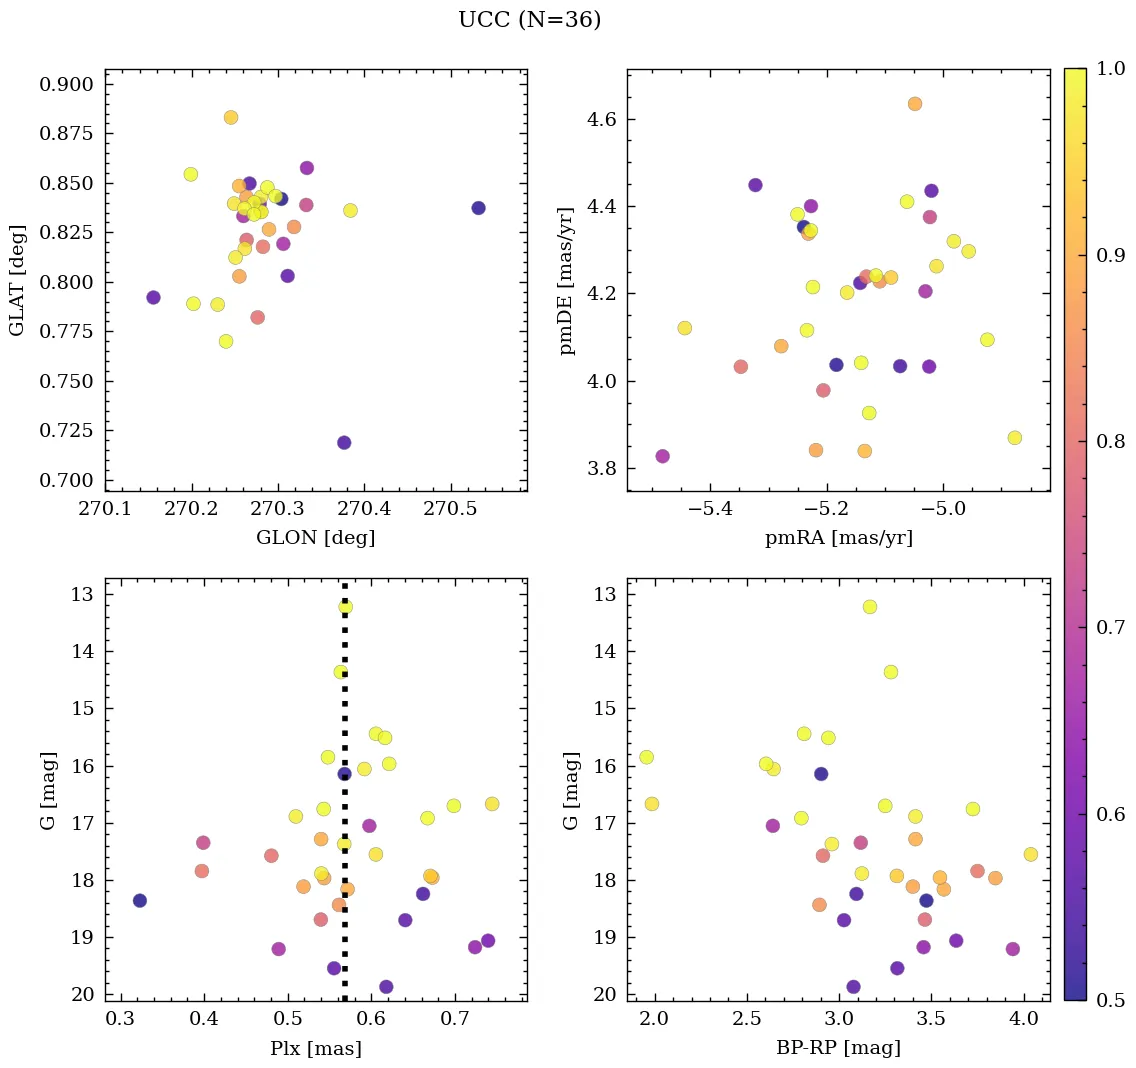
💡 Note: The UCC values are estimated from its identified members.
| Reference | Year | Dist [kpc] | Av [mag] | DAv [mag] | Age [Myr] | [Fe/H] [dex] | Mass [Msun] | Bfrac | BSS |
|---|---|---|---|---|---|---|---|---|---|
| UCC | 99999– | 1.175 | 6.2 | 2.75 | 32 | 0.570 | 161 | – | – |
| Hunt & Reffert | 2024 | 1.60 | 5.24 | 2.75 | 98 | – | 311(1) | – | – |
| Cavallo et al. | 2024 | 2.98 | 4.95 | – | 102 | 0.570 | – | – | – |
| Hunt & Reffert | 2023 | 1.60 | 5.24 | 2.75 | 98 | – | – | – | – |
| Just et al. | 2023 | – | – | – | 32 | – | 11 | – | – |
| Joshi et al. | 2016 | 0.75 | 7.16 | – | 32 | – | – | – | – |
| Kharchenko et al. | 2016 | 0.75 | 7.16 | – | 32 | – | – | – | – |
| Kharchenko et al. | 2013 | 0.75 | 7.16 | – | 32 | – | – | – | – |
(N): Indicates that there are N extra values assigned to this parameter in the corresponding reference.
Cavallo et al. (2024)
Wood sample.
Hunt & Reffert (2024)
Classified as open cluster. CMD classes: 0.15 (50th percentile), false positive (human-assigned).
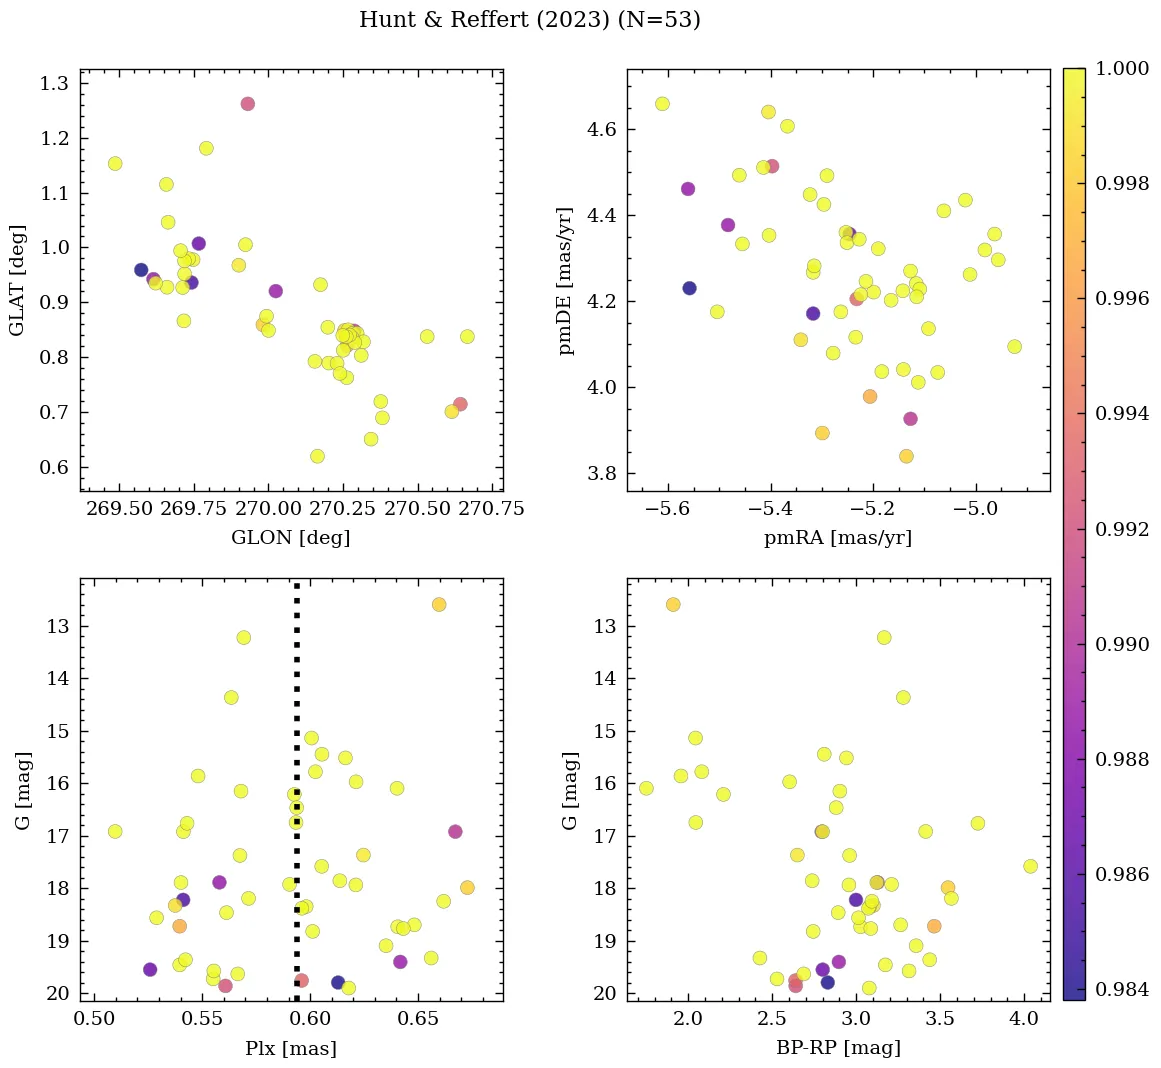
Hunt & Reffert (2023)
Classified as open cluster. CMD classes: 0.15 (50th percentile), false positive (human-assigned).
Dutra et al. (2003)
Classified as infrared cluster (IRC).