Czernik 30
(MWSC 1253; OCL 574)
0.88
UTI
0.77
CN
0.75
Cdens
1.0
CC3
0.94
Clit
1.0
Cdup
Nm (P>50%)
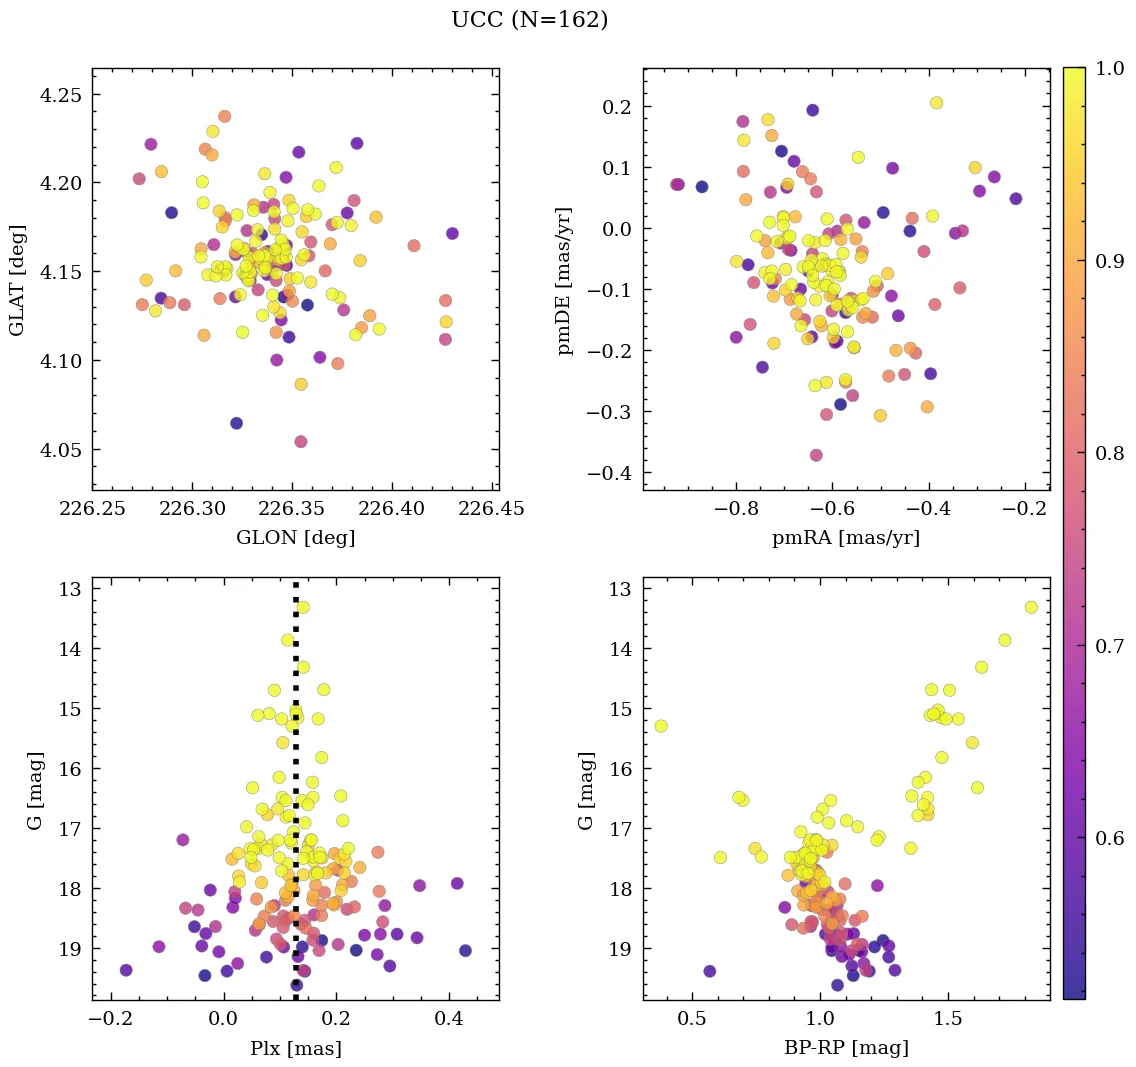
162
Core radius and density
2.1 [pc], 3.8 [pc-2]
- CN 0.77 Rich
- Cdens 0.75 Dense
- CC3 1.0 Very high quality
- Clit 0.94 Very well-studied
- Cdup 1.0 Unique
 MOCA
MOCA
Overview
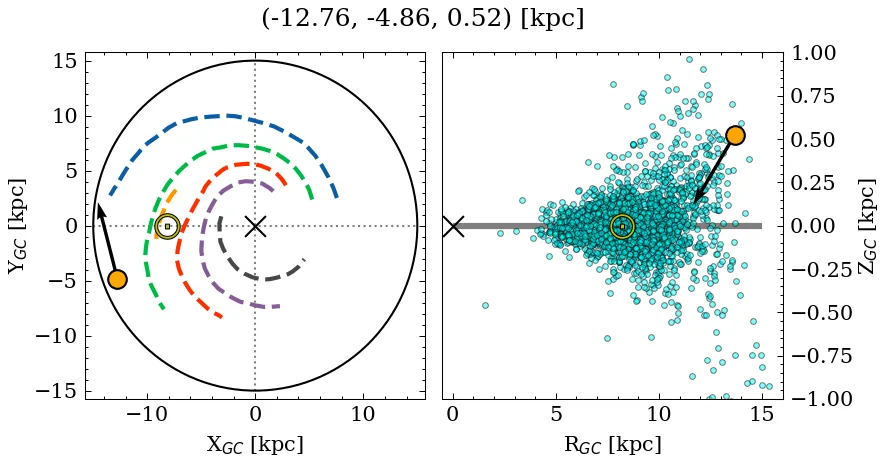
Czernik 30 is a rich, dense object of very high C3 quality. Its parallax locates it at a large distance, well above the mid-plane, affected by low extinction. It is catalogued as a massive, near-solar metallicity, old cluster, but with a large variance across recent sources for the age, metallicity, and mass parameters (see Parameters). It is very well-studied in the literature.
Note: This object contains blue stragglers according to at least one source.
Data
| Reference | Year | RA [deg] | DEC [deg] | Plx [mas] | pmRA [mas/yr] | pmDE [mas/yr] | Rv [km/s] |
|---|---|---|---|---|---|---|---|
| UCC | 99999– | 112.795 | -9.946 | 0.128 | -0.613 | -0.072 | 81.361 |
| Li et al. | 2026 | 112.8 | -9.94 | – | – | – | – |
| Otto et al. | 2026 | 112.795 | -9.946 | – | -0.59 | -0.1 | 81.5 |
| Hu & Soubiran | 2025 | 112.797 | -9.947 | – | – | – | – |
| Almeida et al. | 2025 | 112.799 | -9.948 | – | – | – | – |
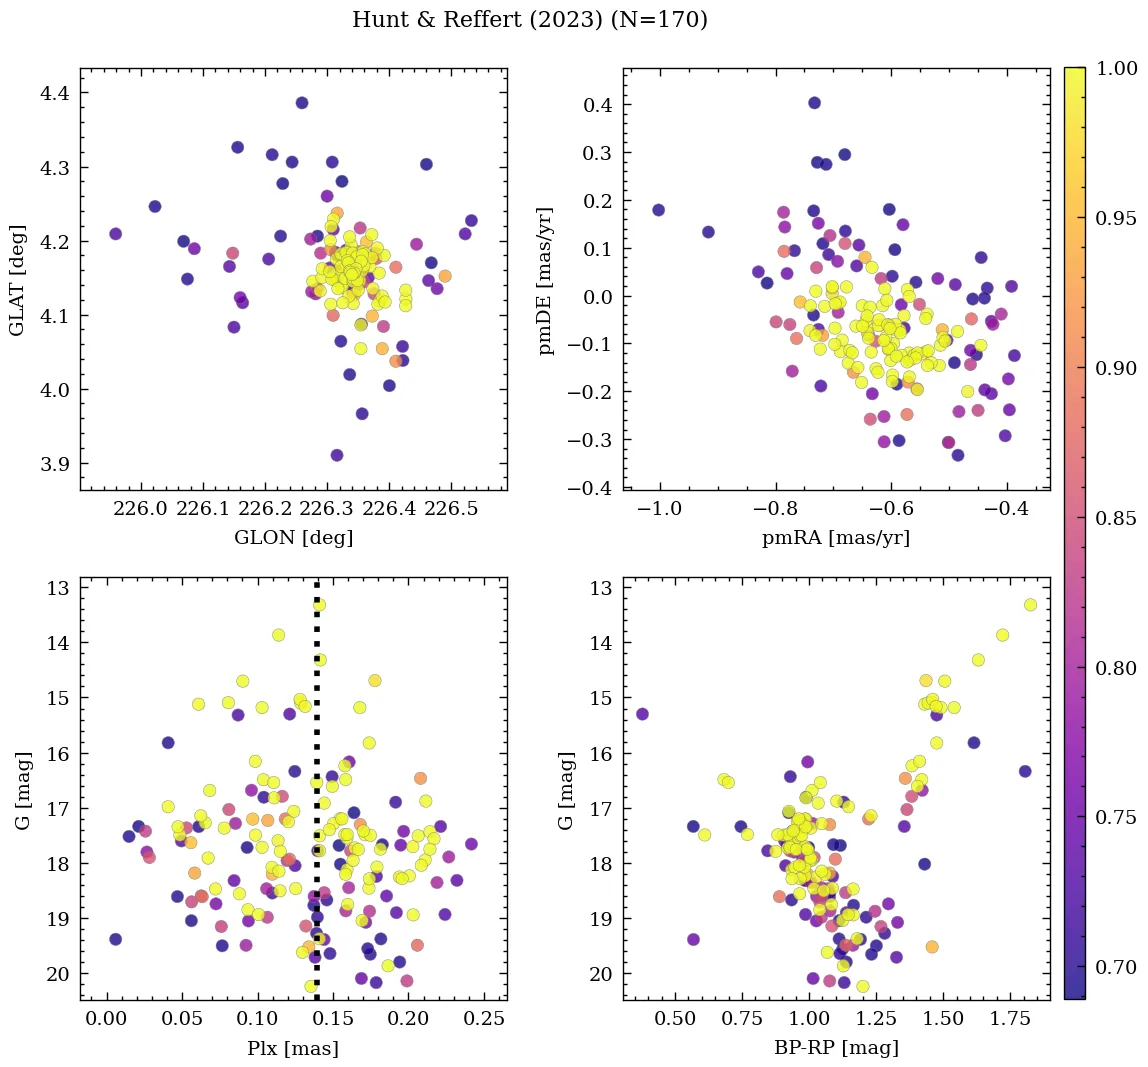
| Hunt & Reffert | 2024 | 112.795 | -9.946 | 0.133 | -0.612 | -0.066 | 81.737 |
| Cavallo et al. | 2024 | 112.797 | -9.947 | 0.128 | – | – | – |
| Hunt & Reffert | 2023 | 112.795 | -9.946 | 0.133 | -0.612 | -0.066 | 81.737 |
| Just et al. | 2023 | 112.79 | -9.938 | – | – | – | – |
| Perren et al. | 2022 | 112.796 | -9.945 | – | – | – | – |
| Jadhav & Subramaniam | 2021 | 112.796 | -9.945 | – | – | – | – |
| Netopil et al. | 2022 | 112.796 | -9.945 | – | – | – | 82.07 |
| Dias et al. | 2021 | 112.799 | -9.948 | 0.113 | -0.592 | -0.106 | – |
| Spina et al. | 2021 | 112.795 | -9.945 | 0.1 | -0.638 | -0.125 | – |
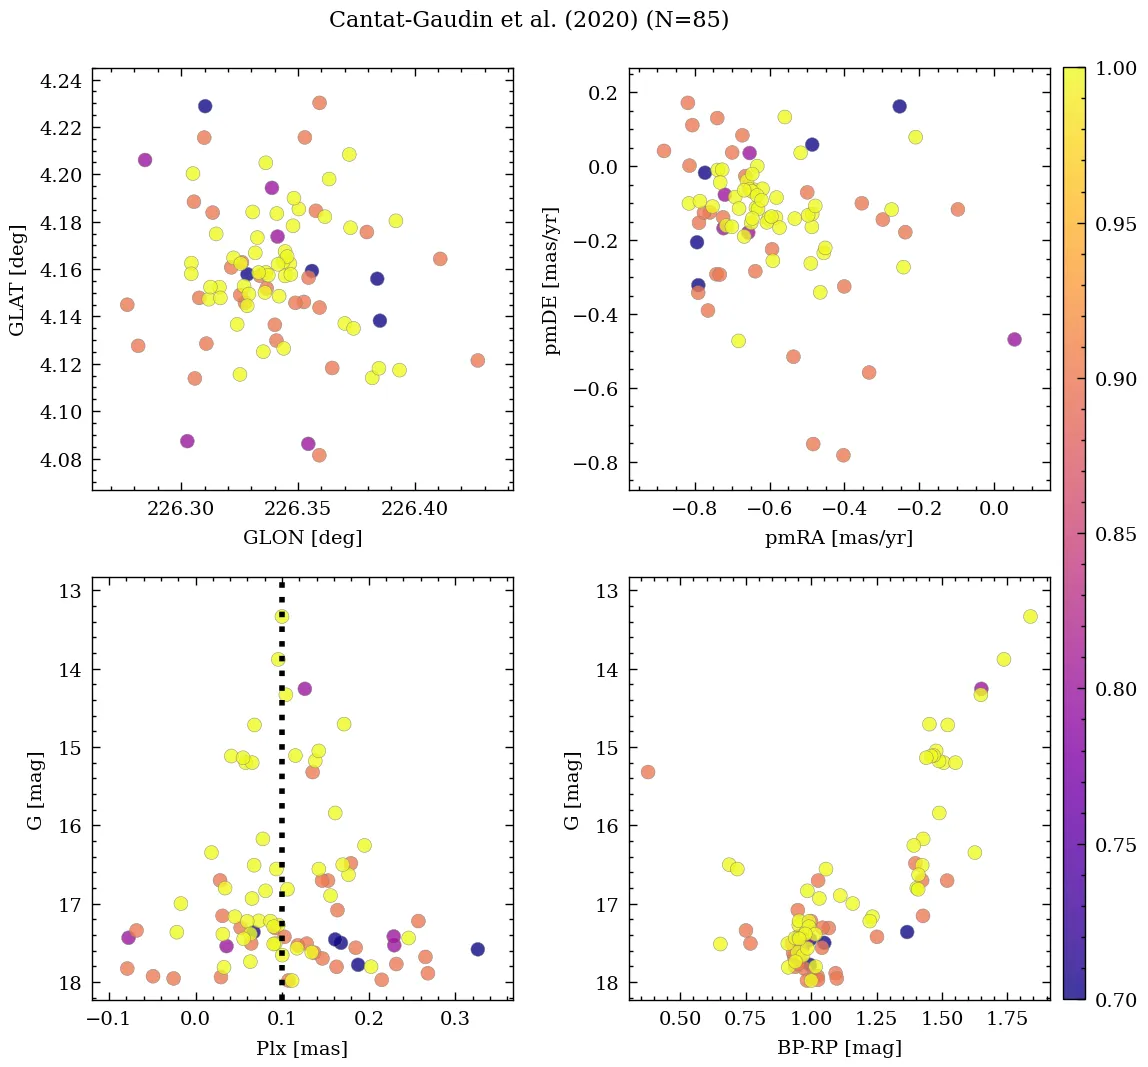
| Cantat-Gaudin et al. | 2020 | 112.796 | -9.945 | 0.11 | -0.587 | -0.097 | – |
| Sánchez et al. | 2020 | 112.825 | -9.967 | – | -0.514 | -0.308 | – |
| Donor et al. | 2020 | 112.797 | -9.94 | – | -0.69 | -0.1 | 81.3 |
| Cantat-Gaudin & Anders | 2020 | 112.796 | -9.945 | 0.11 | -0.587 | -0.097 | – |
| Bica et al. | 2019 | 112.786 | -9.944 | – | – | – | – |
| Cantat-Gaudin et al. | 2018 | 112.796 | -9.945 | 0.11 | -0.587 | -0.097 | – |
| Dias et al. | 2018 | – | – | – | -1.85 | 0.56 | – |
| Loktin & Popova | 2017 | 112.785 | -9.94 | – | -1.874 | 1.12 | 79.9 |
| Sampedro et al. | 2017 | 112.825 | -9.967 | – | -3.57 | -2.72 | – |
| Dias et al. | 2016 | 112.825 | -9.967 | – | -1.43 | -1.94 | 79.9 |
| Kharchenko et al. | 2016 | 112.79 | -9.938 | – | – | – | – |
| Tadross | 2014 | 112.825 | -9.967 | – | – | – | – |
| Kharchenko et al. | 2013 | 112.797 | -9.94 | – | -1.89 | 0.94 | – |
| Gozha et al. | 2012 | 112.825 | -9.967 | – | – | – | – |
| Bukowiecki et al. | 2011 | 112.792 | -9.939 | – | – | – | – |
| Dias et al. | 2002 | 112.825 | -9.967 | – | – | – | – |
| Lynga | 1987 | 112.818 | -9.961 | – | – | – | – |
| Alter et al. | 1970 | 112.823 | -9.969 | – | – | – | – |
💡 Note: The UCC values are estimated from its identified members.
| Reference | Year | Dist [kpc] | Av [mag] | DAv [mag] | Age [Myr] | [Fe/H] [dex] | Mass [Msun] | Bfrac | BSS |
|---|---|---|---|---|---|---|---|---|---|
| UCC | 99999– | 6.55 | 0.835 | 1.51 | 2512 | -0.380 | 2939 | 0.79 | 5 |
| Otto et al. | 2026 | – | – | – | 2884 | -0.380(15) | – | – | – |
| Hu & Soubiran | 2025 | – | – | – | – | -0.330(5) | – | – | – |
| Almeida et al. | 2025 | 5.94 | 0.96 | – | 2985 | – | 2172 | – | – |
| Hunt & Reffert | 2024 | 6.24 | 0.91 | 1.51 | 1081 | – | 1037(1) | – | – |
| Cavallo et al. | 2024 | 5.04 | 1.23 | – | 4169 | -0.740 | – | – | – |
| Hunt & Reffert | 2023 | 6.23 | 0.91 | 1.51 | 1081 | – | – | – | – |
| Just et al. | 2023 | – | – | – | 1585 | – | 3133 | – | – |
| Perren et al. | 2022 | 6.55 | 0.91 | – | 3631 | -0.320 | 7200 | 0.79 | – |
| Spina et al. | 2022 | – | – | – | – | -0.400 | – | – | – |
| Jadhav & Subramaniam | 2021 | 6.64 | 0.62 | – | 2884 | – | 2939 | – | 5(1) |
| Netopil et al. | 2022 | 7.24(1) | – | – | 2512 | -0.400(1) | – | – | – |
| Dias et al. | 2021 | 5.94 | 0.96 | – | 2985 | -0.282 | – | – | – |
| Spina et al. | 2021 | 5.47 | – | – | 2884 | -0.396(20) | – | – | – |
| Cantat-Gaudin et al. | 2020 | 6.64 | 0.62 | – | 2884 | – | – | – | – |
| Kounkel et al. | 2020 | 4.96 | 1.13 | – | 1122 | – | – | – | – |
| Donor et al. | 2020 | – | – | – | – | -0.400 | – | – | – |
| Cantat-Gaudin & Anders | 2020 | 7.19 | – | – | – | – | – | – | – |
| Cantat-Gaudin et al. | 2018 | 7.19 | – | – | – | – | – | – | – |
| Loktin & Popova | 2017 | 2.45 | 0.09 | – | 490 | – | – | – | – |
| Dias et al. | 2016 | 9.12 | 0.76 | – | 2512 | -0.210 | – | – | – |
| Kharchenko et al. | 2016 | 6.81 | 0.33 | – | 1585 | – | – | – | – |
| Perren et al. | 2015 | 8.00(1) | 0.32(1) | – | 3162(1) | 0.070(1) | – | – | – |
| Tadross | 2014 | 2.27 | 1.10 | – | 130 | – | – | – | – |
| Kharchenko et al. | 2013 | 6.81 | 0.33 | – | 1585 | -0.380 | – | – | – |
| Gozha et al. | 2012 | 7.14 | – | – | 2512 | -0.380 | – | – | – |
| Bukowiecki et al. | 2011 | 6.34(1) | 0.28 | – | 2512 | – | – | – | – |
(N): Indicates that there are N extra values assigned to this parameter in the corresponding reference.
Li et al. (2026)
Tidal & Core radii: r_t=107+/-80.0 [pc], r_c=0.34+/-0.0 [pc]; stars within r_t: N~59
Almeida et al. (2025)
Mass determination: invalid due to poor quality CMD. Isochrone match: worst fit.
Cavallo et al. (2024)
Gold sample.
Hunt & Reffert (2024)
Classified as open cluster. CMD class: 0.97 (50th percentile).
Hunt & Reffert (2023)
Classified as open cluster. CMD class: 0.97 (50th percentile).
Perren et al. (2022)
The CMD shows a robust main sequence and a well-defined giant branch, with the TO at approximately G=17.5. ASteCA gives a distance of 6.5 kpc and an age of 3.6 Gyr, in good agreement with Dias 2021 (5.9 kpc, 3 Gyr). Hayes 2015 found 9.12 kpc and 2.8 Gyr, and seven prior studies all give distances in the range 7.9–9.3 kpc, all of which appear to overestimate the distance. CG20, WEBDA, and MWSC are consistent with ASteCA at 6.2–6.8 kpc. The OC02 value of 9.1 kpc is rejected. A footnote notes that the distance modulus quoted in Table 7 of Hayes et al. is incorrect.
Hu et al. (2021)
Ellipticities (core, all): e_core=0.0504, e_all=0.1815.