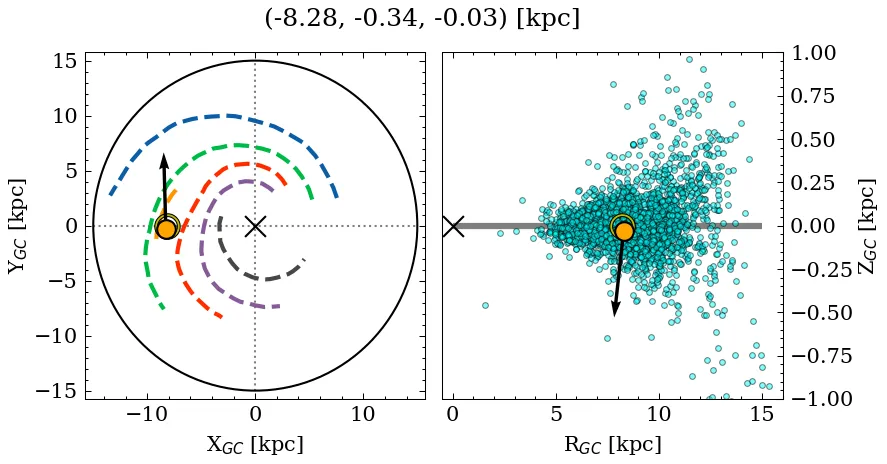
Collinder 140
(MWSC 1199; FoF 2397; OCSN 191)
0.91
UTI
0.82
CN
0.74
Cdens
1.0
CC3
1.0
Clit
1.0
Cdup
Nm (P>50%)
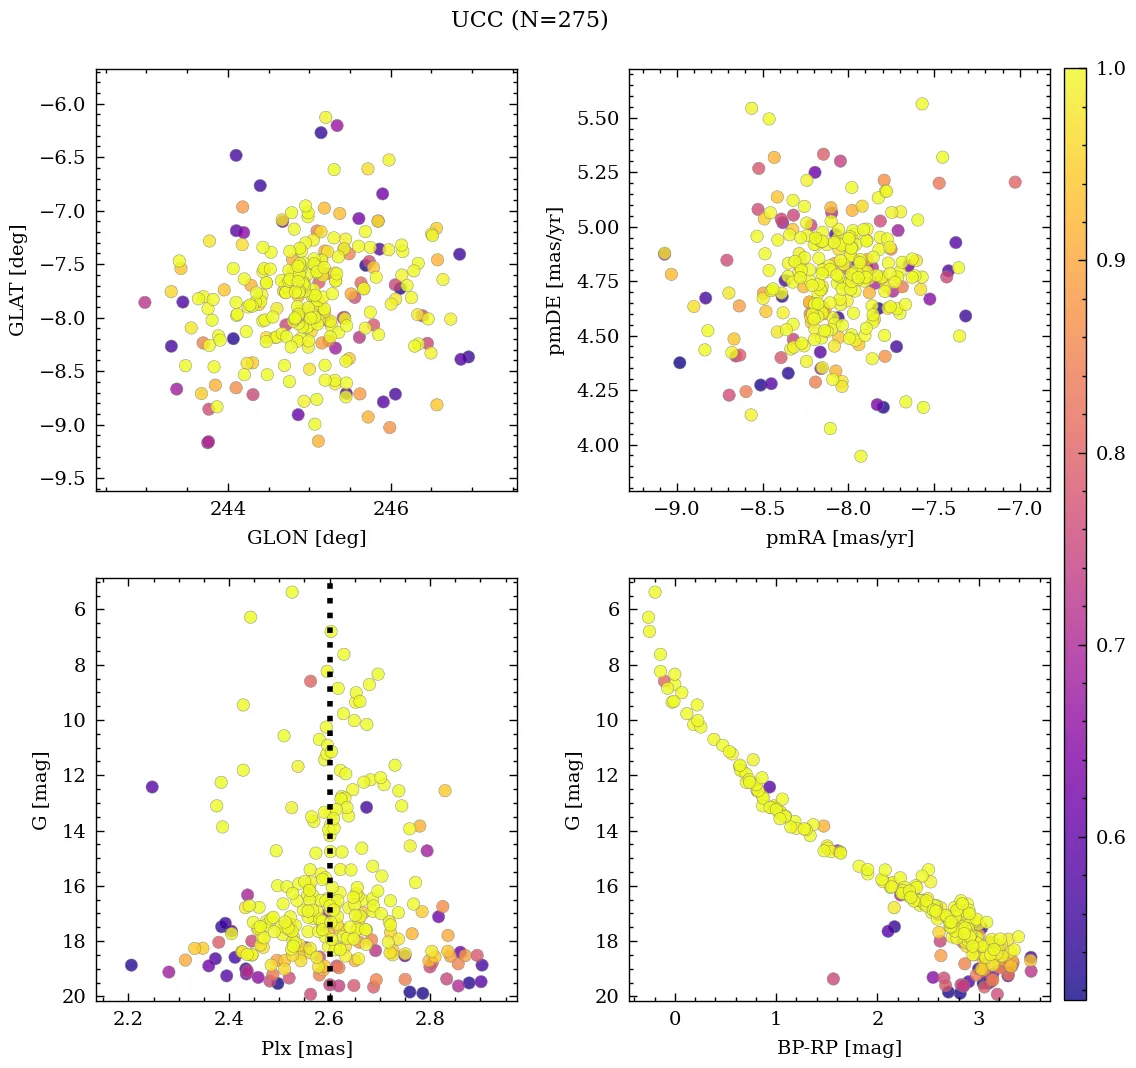
275
Core radius and density
2.0 [pc], 3.7 [pc-2]
- CN 0.82 Rich
- Cdens 0.74 Moderately dense
- CC3 1.0 Very high quality
- Clit 1.0 Very well-studied
- Cdup 1.0 Unique
 MOCA
MOCA
Overview
Collinder 140 is a rich, moderately dense object of very high C3 quality. Its parallax locates it at a very close distance, near the mid-plane, affected by low extinction. It is catalogued as a near-solar metallicity, young cluster, but with a large variance across recent sources for the absorption parameter (see Parameters). It is very well-studied in the literature.
Data
| Reference | Year | RA [deg] | DEC [deg] | Plx [mas] | pmRA [mas/yr] | pmDE [mas/yr] | Rv [km/s] |
|---|---|---|---|---|---|---|---|
| UCC | 99999– | 110.904 | -31.986 | 2.601 | -8.079 | 4.766 | 16.809 |
| Liu et al. | 2025 | 110.8 | -32.01 | 2.59 | -8.09 | 4.76 | 14.58 |
| Li et al. | 2025 | 110.882 | -31.966 | 2.594 | -8.074 | 4.789 | – |
| Almeida et al. | 2025 | 110.846 | -32.004 | – | – | – | – |
| Alfonso et al. | 2024 | 110.907 | -31.984 | 2.574 | -8.055 | 4.767 | – |
| Swiggum et al. | 2024 | 110.802 | -32.012 | 2.591 | -8.088 | 4.756 | 16.862 |
| Hunt & Reffert | 2024 | 110.802 | -32.012 | 2.591 | -8.088 | 4.756 | 14.576 |
| Celli et al. | 2024 | 110.882 | -31.966 | – | – | – | – |
| Cavallo et al. | 2024 | 110.899 | -32.087 | 2.596 | – | – | – |
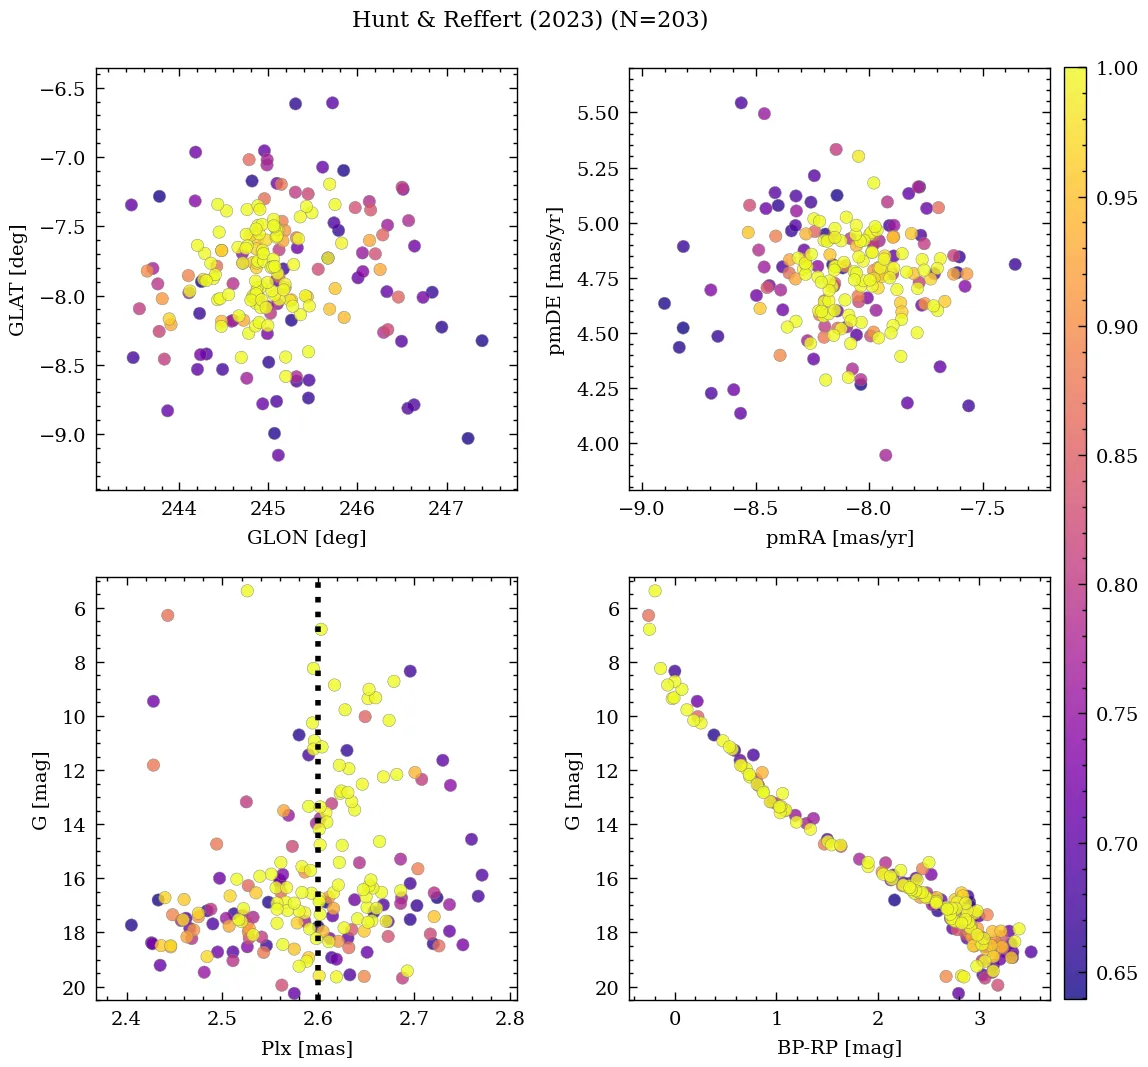
| Hunt & Reffert | 2023 | 110.802 | -32.012 | 2.591 | -8.088 | 4.756 | 14.576 |
| Almeida et al. | 2023 | 110.944 | -31.995 | – | – | – | – |
| Qin et al. | 2023 | 110.91 | -31.99 | 2.57 | -8.06 | 4.73 | 17.78 |
| Just et al. | 2023 | 111.024 | -31.888 | – | – | – | – |
| He et al. | 2022 | 110.813 | -32.051 | 2.624 | -8.141 | 4.811 | – |
| Jaehnig et al. | 2021 | 110.909 | -31.969 | 2.603 | -8.14 | 4.727 | – |
| Rain et al. | 2021 | 110.882 | -31.966 | 2.594 | -8.074 | 4.789 | – |
| Richer et al. | 2021 | 111.179 | -32.284 | 2.529 | -8.026 | 4.785 | – |
| Dias et al. | 2021 | 110.846 | -32.004 | 2.553 | -8.045 | 4.783 | 19.669 |
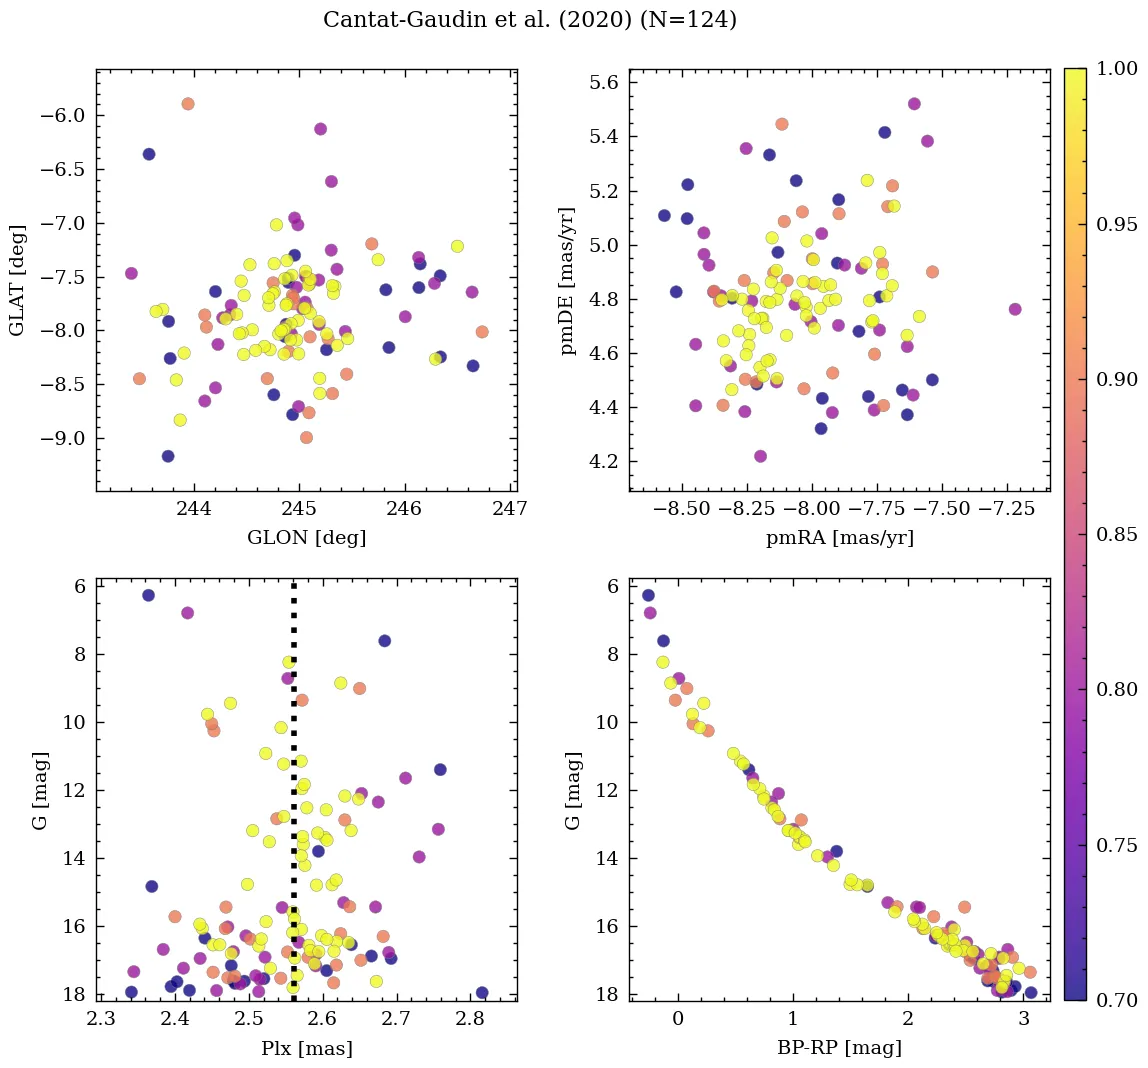
| Cantat-Gaudin et al. | 2020 | 110.882 | -31.966 | 2.594 | -8.074 | 4.789 | – |
| Cantat-Gaudin & Anders | 2020 | 110.882 | -31.966 | 2.594 | -8.074 | 4.789 | – |
| Liu & Pang | 2019 | 110.758 | -31.887 | 2.547 | -8.023 | 4.695 | – |
| Dias et al. | 2019 | 111.883 | -31.966 | 2.594 | -8.074 | 4.789 | 16.018 |
| Bossini et al. | 2019 | 110.882 | -31.966 | – | – | – | – |
| Soubiran et al. | 2018 | 110.882 | -31.966 | – | – | – | 19.65 |
| Cantat-Gaudin et al. | 2018 | 110.882 | -31.966 | 2.594 | -8.074 | 4.789 | – |
| Dib et al. | 2018 | 111.03 | -31.89 | – | – | – | – |
| Loktin & Popova | 2017 | 111.105 | -31.849 | – | -1.751 | 2.975 | 22.9 |
| Sampedro et al. | 2017 | 111.112 | -31.85 | – | -1.75 | 3.61 | – |
| Joshi et al. | 2016 | 111.03 | -31.89 | – | – | – | – |
| Kharchenko et al. | 2016 | 111.024 | -31.888 | – | – | – | – |
| Netopil et al. | 2016 | 111.112 | -31.85 | – | – | – | – |
| Dias et al. | 2014 | 111.112 | -31.85 | – | -1.89 | 3.61 | – |
| Kharchenko et al. | 2013 | 111.03 | -31.89 | – | -7.9 | 4.28 | 22.9 |
| Gozha et al. | 2012 | 111.112 | -31.85 | – | – | – | – |
| Piskunov et al. | 2008 | 110.816 | -32.058 | – | – | – | – |
| Kharchenko et al. | 2007 | 111.1 | -31.85 | – | 0.5 | – | 22.93 |
| Ahumada & Lapasset | 2007 | 110.8 | -32.033 | – | – | – | – |
| van den Bergh | 2006 | 110.825 | -32.067 | – | – | – | – |
| Kharchenko et al. | 2005 | 110.82 | -32.06 | – | -8.5 | 3.67 | 22.93 |
| Kharchenko et al. | 2003 | 110.82 | -32.06 | – | -8.93 | 3.91 | – |
| Chen et al. | 2003 | 110.866 | -32.13 | – | -8.27 | 4.52 | 10.5 |
| Dias et al. | 2002 | 111.112 | -31.85 | – | -7.33 | 2.7 | 19.34 |
| Dambis | 1999 | 111.112 | -31.85 | – | – | – | – |
| Lynga | 1987 | 110.954 | -32.198 | – | – | – | 17.0 |
| van den Bergh & Hagen | 1975 | 110.5 | -32.1 | – | – | – | – |
💡 Note: The UCC values are estimated from its identified members.
| Reference | Year | Dist [kpc] | Av [mag] | DAv [mag] | Age [Myr] | [Fe/H] [dex] | Mass [Msun] | Bfrac | BSS |
|---|---|---|---|---|---|---|---|---|---|
| UCC | 99999– | 0.39 | 0.095 | 0.595 | 35 | -0.003 | 132 | 0.34 | 0 |
| Liu et al. | 2025 | 0.39 | 0.04 | – | 33 | – | – | – | – |
| Li et al. | 2025 | 0.39 | 0.10 | – | 42 | 0.149 | – | – | – |
| Almeida et al. | 2025 | 0.38 | 0.14 | – | 40 | – | 165 | – | – |
| Alfonso et al. | 2024 | 0.39 | 0.00 | – | 28 | 0.011 | – | – | – |
| Swiggum et al. | 2024 | 0.38 | – | – | 17 | – | 229 | – | – |
| Hunt & Reffert | 2024 | 0.37 | 0.10 | 0.60 | 17 | – | 130(1) | – | – |
| Celli et al. | 2024 | – | – | – | 27 | – | 135 | – | – |
| Cavallo et al. | 2024 | 0.40 | 0.49 | – | 15 | -0.070 | – | – | – |
| Hunt & Reffert | 2023 | 0.37 | 0.10 | 0.59 | 17 | – | – | – | – |
| Almeida et al. | 2023 | 0.38 | 0.19 | – | 42 | -0.005 | 308(1) | 0.34 | – |
| Qin et al. | 2023 | 0.43 | 0.22 | – | 32 | – | – | – | – |
| Just et al. | 2023 | – | – | – | 50 | – | 34 | – | – |
| He et al. | 2022 | – | 0.15 | – | 32 | – | – | – | – |
| Jaehnig et al. | 2021 | 0.39(1) | – | – | – | – | – | – | – |
| Rain et al. | 2021 | 0.38 | 0.09 | – | 30 | – | – | – | 0 |
| Richer et al. | 2021 | – | 0.15 | – | 35 | – | – | – | – |
| Dias et al. | 2021 | 0.38 | 0.14 | – | 40 | 0.011 | – | – | – |
| Cantat-Gaudin et al. | 2020 | 0.39 | 0.00 | – | 27 | – | – | – | – |
| Kounkel et al. | 2020 | 0.40 | 0.23 | – | 39 | – | – | – | – |
| Cantat-Gaudin & Anders | 2020 | 0.38 | – | – | – | – | – | – | – |
| Liu & Pang | 2019 | – | – | – | 32 | 0.000 | – | – | – |
| Dias et al. | 2019 | 0.40 | 0.09 | – | 45 | 0.097 | – | – | – |
| Bossini et al. | 2019 | 0.36 | 0.10 | – | 30 | 0.010 | – | – | – |
| Soubiran et al. | 2018 | 0.38 | – | – | – | – | – | – | – |
| Cantat-Gaudin et al. | 2018 | 0.38 | – | – | – | – | – | – | – |
| Dib et al. | 2018 | 0.39 | – | – | 50 | – | – | – | – |
| Loktin & Popova | 2017 | 0.40 | 0.09 | – | 35 | – | – | – | – |
| Joshi et al. | 2016 | 0.39 | 0.16 | – | 50 | – | 115 | – | – |
| Kharchenko et al. | 2016 | 0.39 | 0.16 | – | 50 | – | – | – | – |
| Netopil et al. | 2016 | 8.17 | – | – | 40 | – | – | – | – |
| Kharchenko et al. | 2013 | 0.39 | 0.16 | – | 50 | -0.100 | – | – | – |
| Gozha et al. | 2012 | 0.41 | – | – | 35 | -0.100 | 115 | – | – |
| Paunzen et al. | 2010 | – | – | – | – | -0.050 | – | – | – |
| Piskunov et al. | 2008 | 0.40 | 0.09 | – | 37 | – | – | – | – |
| Ahumada & Lapasset | 2007 | – | 0.09 | – | 35 | – | – | – | 0 |
| van den Bergh | 2006 | 0.41 | 0.09 | – | 35 | – | – | – | – |
| Kharchenko et al. | 2005 | 0.40 | 0.09 | – | 37 | – | – | – | – |
| Kharchenko et al. | 2003 | 0.41 | 0.09 | – | – | – | – | – | – |
| Chen et al. | 2003 | 0.41 | 0.09 | – | 30 | -0.100(1) | – | – | – |
| Dias et al. | 2002 | 0.41 | 0.09 | – | 35 | -0.100 | – | – | – |
| Dambis | 1999 | 0.35 | 0.08 | – | 40 | – | – | – | – |
| Lynga | 1987 | 0.30 | 0.00 | – | 22 | 0.050 | – | – | – |
(N): Indicates that there are N extra values assigned to this parameter in the corresponding reference.
Liu et al. (2025)
Classified as primordial binary cluster 127 along with OCSN_82, and as primordial binary cluster 298 along with NGC_2451B, and of multiple system 43 along with OCSN_82 and NGC_2451B.
Palma et al. (2025)
Part of multiple system G231, along with Theia_249, OCSN_82 and NGC_2451B.
Almeida et al. (2025)
Mass determination: good fit. Isochrone match: good fit. Gold sample.
Cavallo et al. (2024)
Gold sample.
Hunt & Reffert (2024)
Classified as open cluster. CMD class: 0.99 (50th percentile).
Hunt & Reffert (2023)
Classified as open cluster. CMD class: 0.99 (50th percentile).
Hu et al. (2021)
Ellipticities (core, all): e_core=0.1584, e_all=0.1746.
Rain et al. (2021)
This cluster was include in (Dias et al., 2002A&A...389..871D, Cat. B/ocl) however, parameters log(t)=7.473, Av=0.105, [Fe/H]=0.010 were taken from Bossini et al. (2019A&A...623A.108B, Cat. J/A+A/623/A108).