Bochum 9
(MWSC 1825)
0.28
UTI
0.0
CN
0.01
Cdens
0.12
CC3
0.63
Clit
1.0
Cdup
Nm (P>50%)
14
Core radius and density
5.1 [pc], 0.06 [pc-2]
- CN 0.0 Sparse
- Cdens 0.01 Very loose
- CC3 0.12 Very low quality
- Clit 0.63 Moderately studied
- Cdup 1.0 Unique
 MOCA
MOCA
Overview
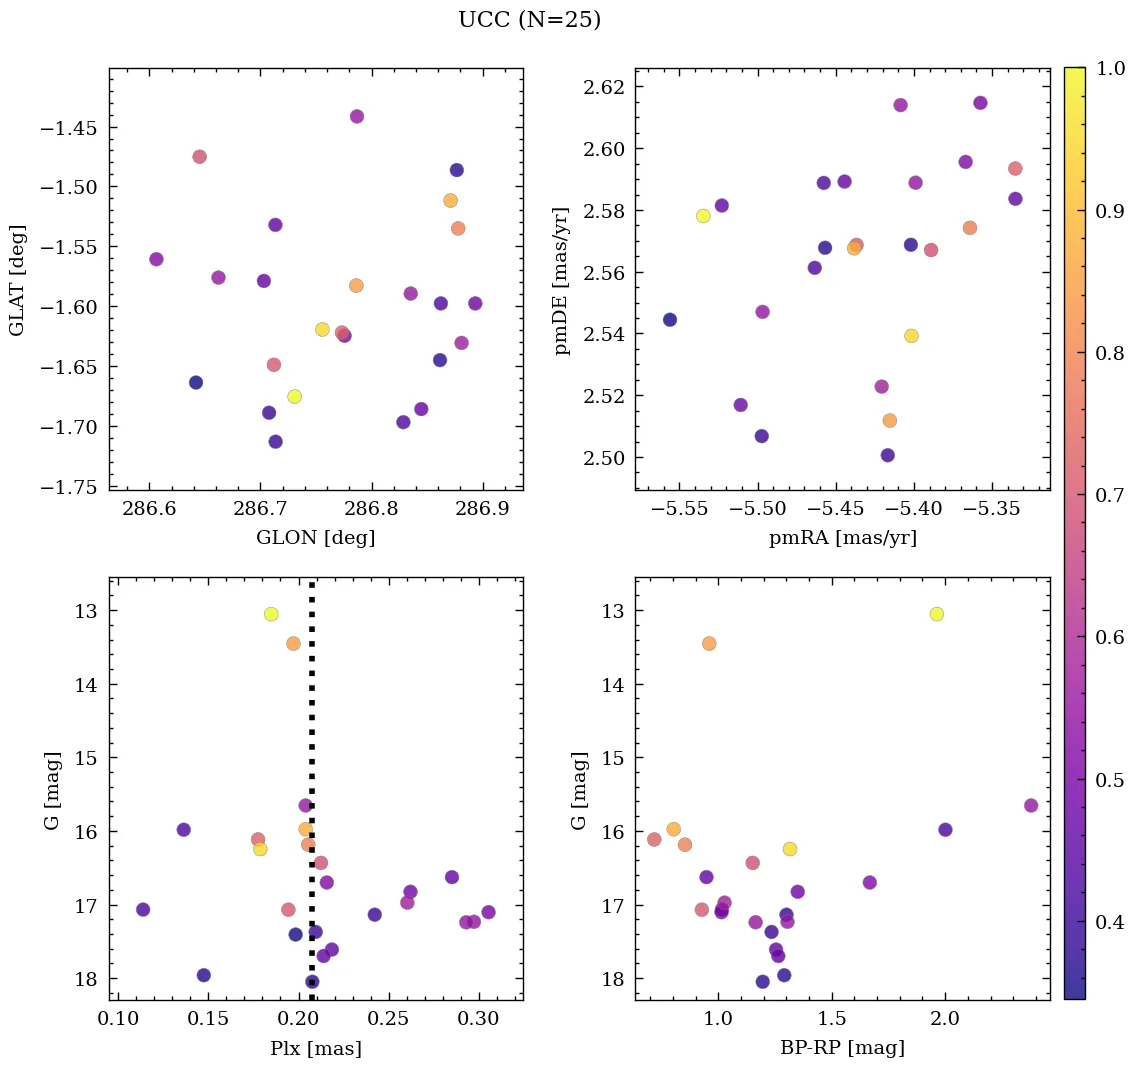
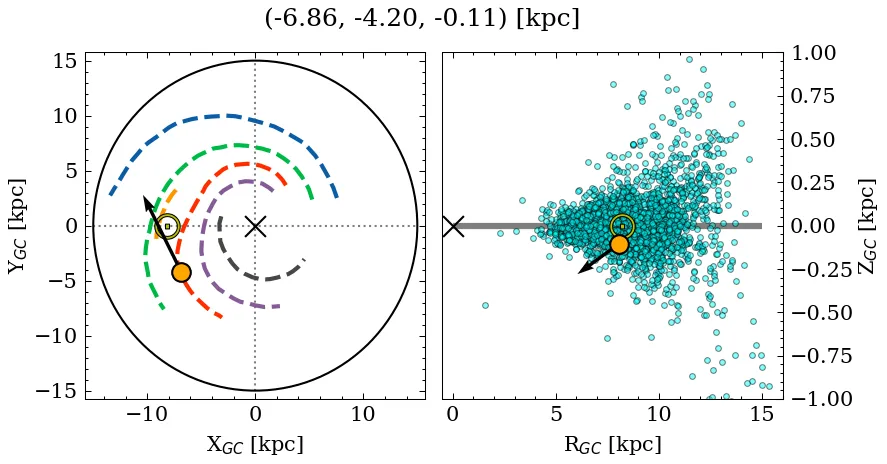
Bochum 9 is a sparse, very loose object of very low C3 quality. Its parallax locates it at a moderate* distance, below the mid-plane, affected by low extinction. It is catalogued as an intermediate-age cluster (see Parameters). It is moderately studied in the literature.
(*): The parallax distance estimate (~4.81 kpc) differs significantly from the median photometric distance (~0.94 kpc).
Data
| Reference | Year | RA [deg] | DEC [deg] | Plx [mas] | pmRA [mas/yr] | pmDE [mas/yr] | Rv [km/s] |
|---|---|---|---|---|---|---|---|
| UCC | 99999– | 158.872 | -60.15 | 0.208 | -5.421 | 2.569 | -0.826 |
| Just et al. | 2023 | 158.92 | -60.126 | – | – | – | – |
| Dib et al. | 2018 | 158.925 | -60.13 | – | – | – | – |
| Sampedro et al. | 2017 | 158.942 | -60.117 | – | -6.26 | -2.54 | – |
| Joshi et al. | 2016 | 158.925 | -60.13 | – | – | – | – |
| Dias et al. | 2016 | 158.942 | -60.117 | – | -6.38 | -2.51 | -9.82 |
| Kharchenko et al. | 2016 | 158.92 | -60.126 | – | – | – | – |
| Dias et al. | 2014 | 158.942 | -60.117 | – | -6.38 | -2.51 | -9.82 |
| Kharchenko et al. | 2013 | 158.925 | -60.13 | – | -10.2 | -0.23 | – |
| Bukowiecki et al. | 2011 | 158.925 | -60.15 | – | – | – | – |
| Kharchenko et al. | 2009 | 158.934 | -60.115 | – | – | – | – |
| Piskunov et al. | 2008 | 158.934 | -60.115 | – | – | – | – |
| van den Bergh | 2006 | 158.94 | -60.126 | – | – | – | – |
| Kharchenko et al. | 2005 | 158.94 | -60.12 | – | -10.46 | 1.34 | – |
| Kharchenko et al. | 2003 | 158.95 | -60.12 | – | -8.98 | 0.36 | – |
| Dias et al. | 2002 | 158.942 | -60.117 | – | – | – | – |
| Lynga | 1987 | 158.942 | -60.129 | – | – | – | – |
💡 Note: The UCC values are estimated from its identified members.
| Reference | Year | Dist [kpc] | Av [mag] | DAv [mag] | Age [Myr] | [Fe/H] [dex] | Mass [Msun] | Bfrac | BSS |
|---|---|---|---|---|---|---|---|---|---|
| UCC | 99999– | 0.94 | 0.35 | – | 123 | – | 66 | – | – |
| Just et al. | 2023 | – | – | – | 123 | – | 28 | – | – |
| Dib et al. | 2018 | 0.94 | – | – | 123 | – | – | – | – |
| Joshi et al. | 2016 | 0.94 | 0.35 | – | 123 | – | 66 | – | – |
| Dias et al. | 2016 | 0.71 | 0.35 | – | 240 | – | – | – | – |
| Kharchenko et al. | 2016 | 0.94 | 0.35 | – | 123 | – | – | – | – |
| Kharchenko et al. | 2013 | 0.94 | 0.35 | – | 123 | – | – | – | – |
| Bukowiecki et al. | 2012 | – | – | – | – | – | 674 | – | – |
| Bukowiecki et al. | 2011 | 3.01(1) | 2.43 | – | 14 | – | – | – | – |
| Kharchenko et al. | 2009 | 0.71 | 0.35 | – | 240 | – | – | – | – |
| Piskunov et al. | 2008 | 0.71 | 0.35 | – | 240 | – | – | – | – |
| van den Bergh | 2006 | 4.60 | 1.99 | – | – | – | – | – | – |
| Kharchenko et al. | 2005 | 0.71 | 0.35 | – | 240 | – | – | – | – |
| Kharchenko et al. | 2003 | 4.60 | 1.99 | – | – | – | – | – | – |
| Dias et al. | 2002 | 4.60 | 1.99 | – | – | – | – | – | – |
(N): Indicates that there are N extra values assigned to this parameter in the corresponding reference.
Bica et al. (2019)
Asterisms and cluster alikes by B. Alessi reported in DAML02.