Bochum 3
(MWSC 1079)
0.90
UTI
0.72
CN
1.0
Cdens
0.75
CC3
1.0
Clit
1.0
Cdup
Stellar density (N50/rad)
14.3 [N/pc2]
- CN 0.72 Moderately populated
- Cdens 1.0 Very dense
- CC3 0.75 High quality
- Clit 1.0 Very well-studied
- Cdup 1.0 Unique
 MOCA
MOCA
Overview
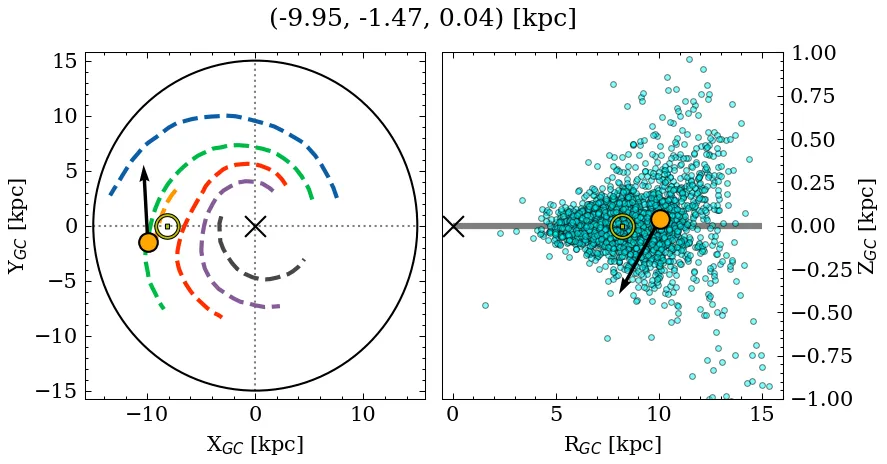
Bochum 3 is a moderately populated, very dense object of high C3 quality. Its parallax locates it at a moderate distance, near the mid-plane, affected by low extinction. It is catalogued as a near-solar metallicity, intermediate-age cluster (see Parameters). It is very well-studied in the literature.
Data
| Reference | Year | RA [deg] | DEC [deg] | Plx [mas] | pmRA [mas/yr] | pmDE [mas/yr] | Rv [km/s] |
|---|---|---|---|---|---|---|---|
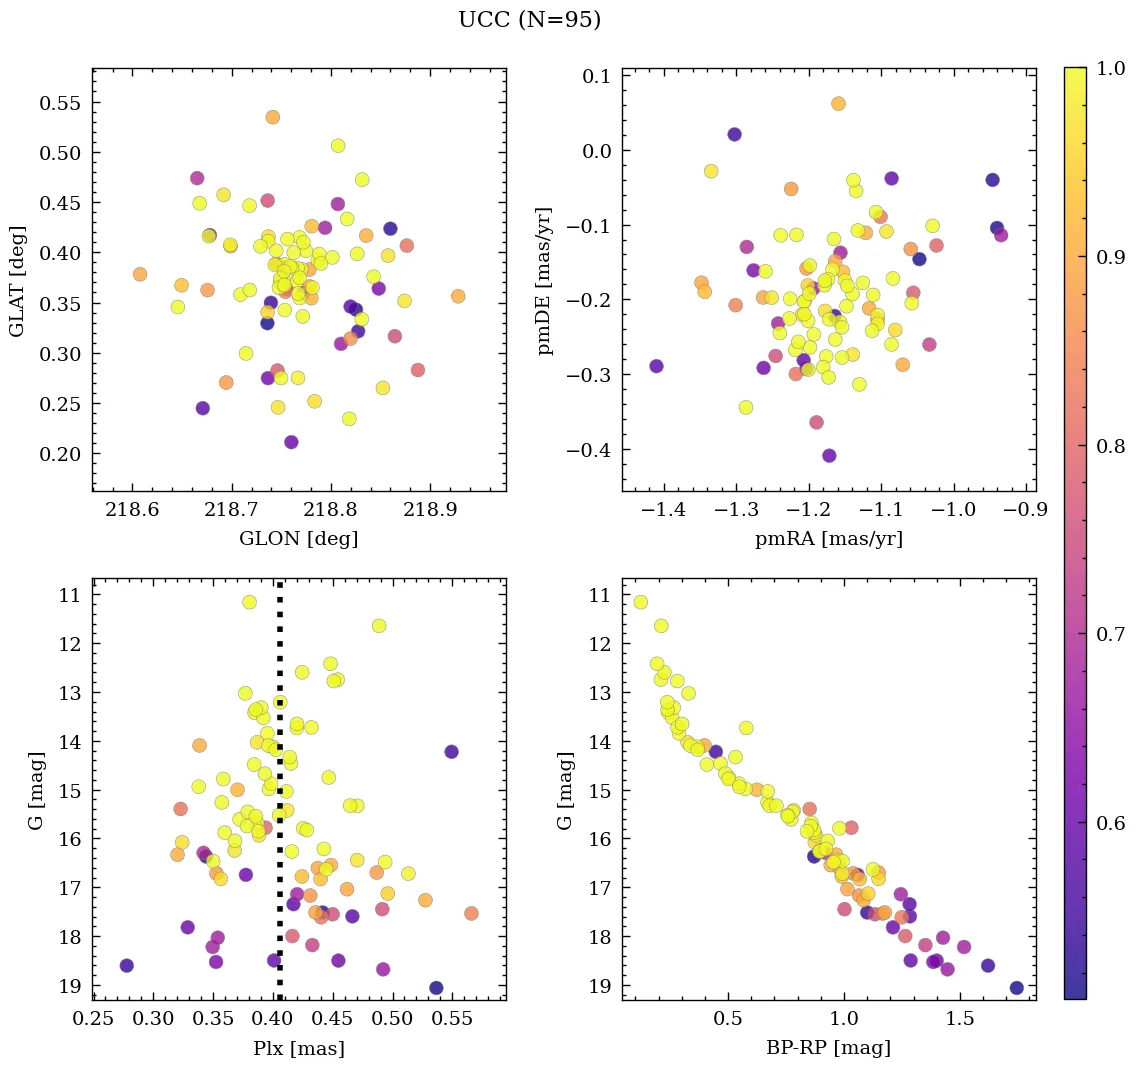
| UCC | 99999– | 105.86 | -5.015 | 0.406 | -1.172 | -0.198 | 29.73 |
| Li et al. | 2025 | 105.86 | -5.021 | 0.448 | -1.174 | -0.19 | – |
| Almeida et al. | 2025 | 105.861 | -5.023 | – | – | – | – |
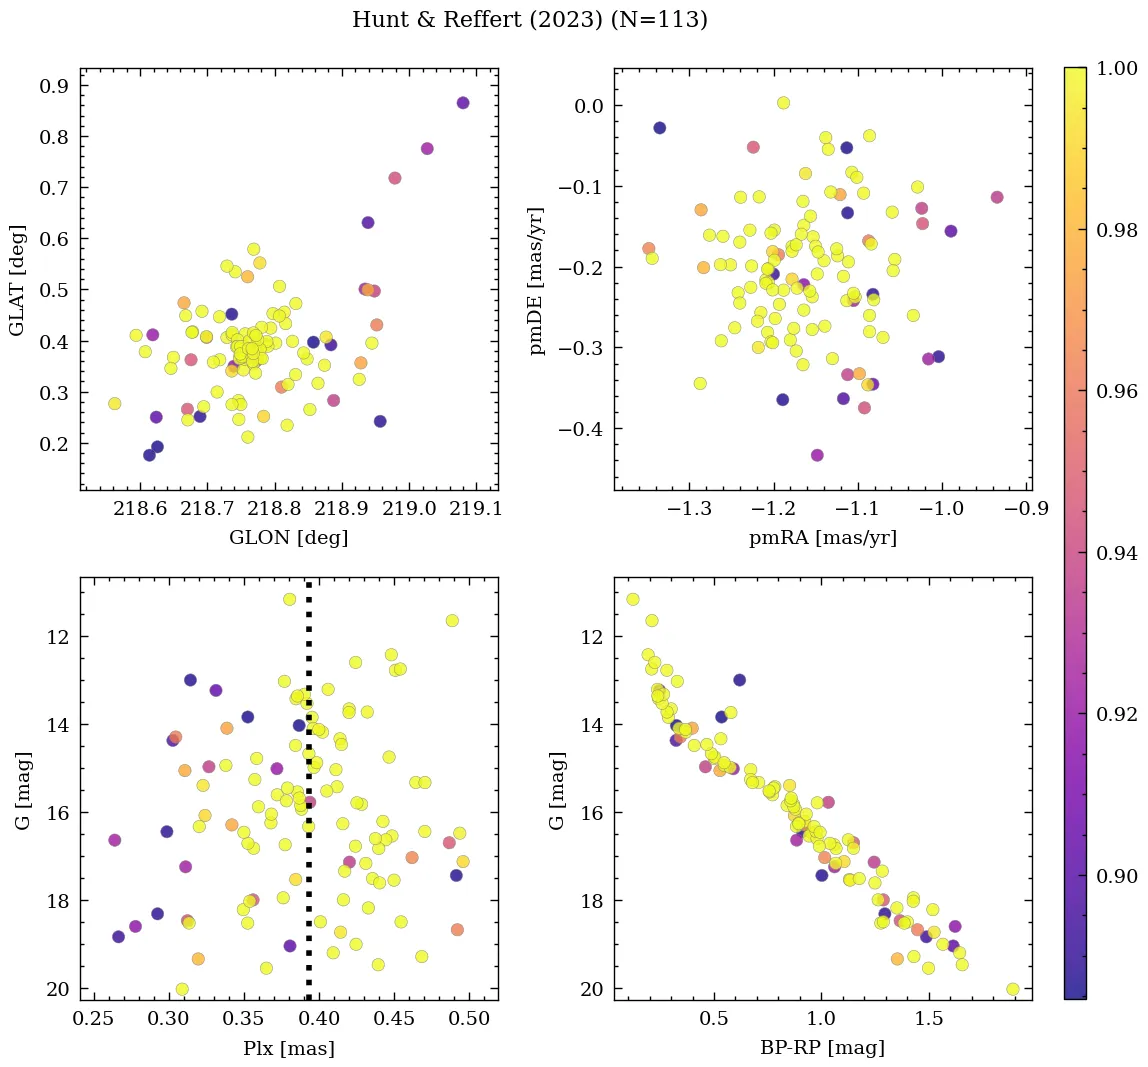
| Hunt & Reffert | 2024 | 105.864 | -5.011 | 0.392 | -1.159 | -0.206 | 29.731 |
| Cavallo et al. | 2024 | 105.87 | -5.018 | 0.396 | – | – | – |
| Hunt & Reffert | 2023 | 105.864 | -5.011 | 0.392 | -1.159 | -0.206 | 29.731 |
| Almeida et al. | 2023 | 105.857 | -5.024 | – | – | – | – |
| Just et al. | 2023 | 105.864 | -5.003 | – | – | – | – |
| Dias et al. | 2021 | 105.861 | -5.023 | 0.453 | -1.178 | -0.195 | – |
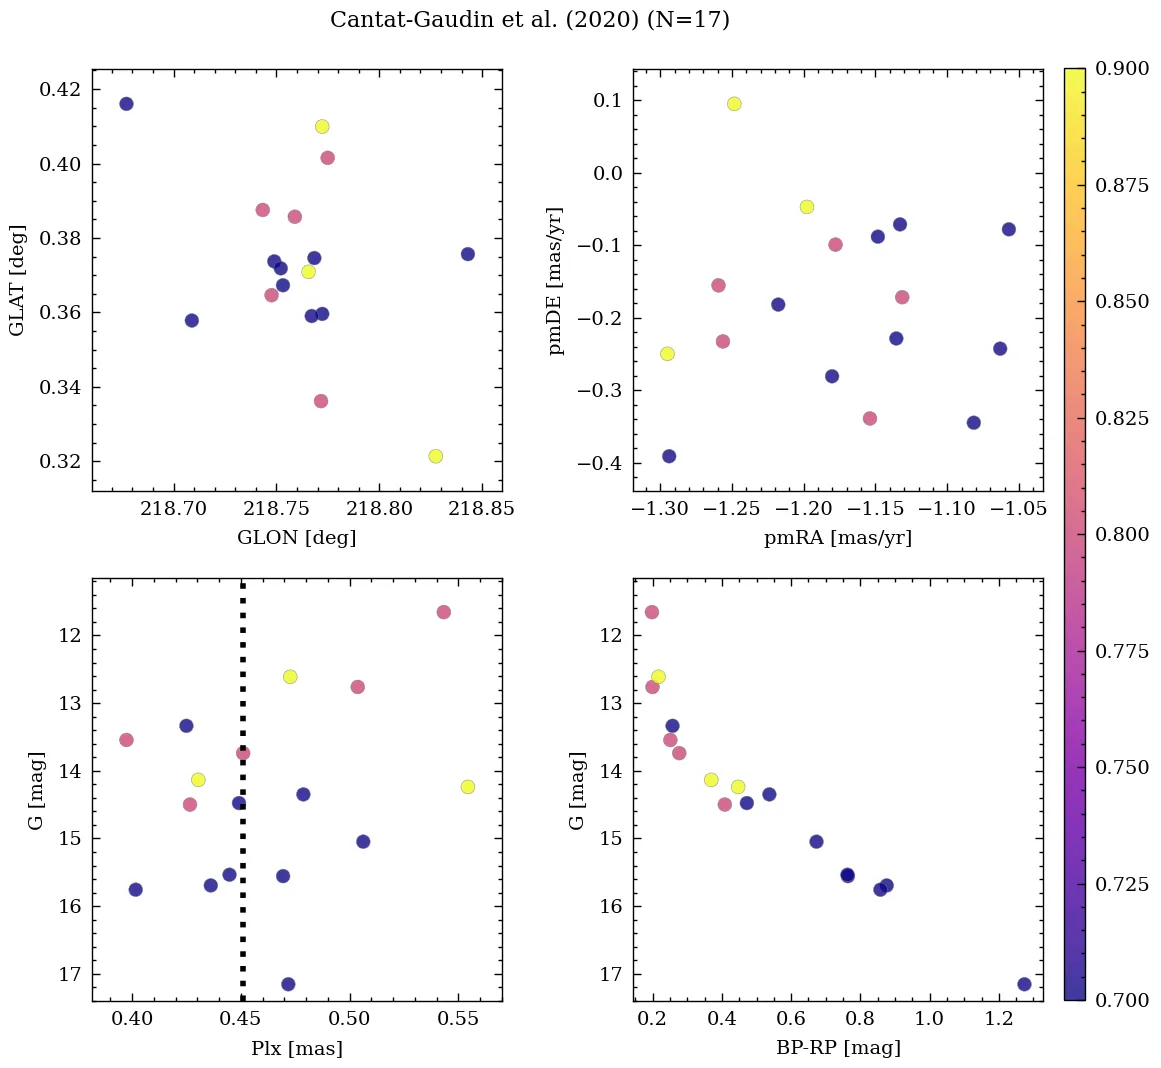
| Cantat-Gaudin et al. | 2020 | 105.86 | -5.021 | 0.448 | -1.174 | -0.19 | – |
| Cantat-Gaudin & Anders | 2020 | 105.86 | -5.021 | 0.448 | -1.174 | -0.19 | – |
| Bossini et al. | 2019 | 105.86 | -5.021 | – | – | – | – |
| Bica et al. | 2019 | 105.863 | -5.011 | – | – | – | – |
| Cantat-Gaudin et al. | 2018 | 105.86 | -5.021 | 0.448 | -1.174 | -0.19 | – |
| Loktin & Popova | 2017 | 105.87 | -5.008 | – | -1.05 | 2.125 | – |
| Kharchenko et al. | 2016 | 105.864 | -5.003 | – | – | – | – |
| Dias et al. | 2014 | 105.85 | -5.05 | – | 0.57 | -1.51 | – |
| Kharchenko et al. | 2013 | 105.87 | -5.005 | – | 0.5 | 2.14 | – |
| Bukowiecki et al. | 2011 | 105.854 | -5.038 | – | – | – | – |
| van den Bergh | 2006 | 105.85 | -5.067 | – | – | – | – |
| Dias et al. | 2002 | 105.85 | -5.05 | – | 0.27 | -0.62 | – |
💡 Note: The UCC values are estimated from its identified members.
| Reference | Year | Dist [kpc] | Av [mag] | DAv [mag] | Age [Myr] | [Fe/H] [dex] | Mass [Msun] | Bfrac | BSS |
|---|---|---|---|---|---|---|---|---|---|
| UCC | 99999– | 2.16 | 0.735 | 0.75 | 125 | -0.099 | 300 | 0.53 | – |
| Li et al. | 2025 | 2.24 | 0.71 | – | 213 | -0.061 | – | – | – |
| Almeida et al. | 2025 | 2.19 | 0.82 | – | 187 | – | 115 | – | – |
| Hunt & Reffert | 2024 | – | – | – | – | – | 493(1) | – | – |
| Cavallo et al. | 2024 | 2.02 | 0.86 | – | 229 | -0.340 | – | – | – |
| Hunt & Reffert | 2023 | 2.28 | 0.53 | 0.75 | 125 | – | – | – | – |
| Almeida et al. | 2023 | 2.17 | 0.73 | – | 252 | -0.099 | 300(1) | 0.53 | – |
| Just et al. | 2023 | – | – | – | 124 | – | 136 | – | – |
| Dias et al. | 2021 | 2.19 | 0.82 | – | 187 | -0.114 | – | – | – |
| Cantat-Gaudin et al. | 2020 | 2.24 | 0.69 | – | 115 | – | – | – | – |
| Cantat-Gaudin & Anders | 2020 | 2.09 | – | – | – | – | – | – | – |
| Bossini et al. | 2019 | 2.46 | 0.70 | – | 38 | 0.000 | – | – | – |
| Cantat-Gaudin et al. | 2018 | 2.09 | – | – | – | – | – | – | – |
| Loktin & Popova | 2017 | 3.97 | 0.33 | – | 347 | – | – | – | – |
| Kharchenko et al. | 2016 | 2.15 | 0.84 | – | 124 | – | – | – | – |
| Kharchenko et al. | 2013 | 2.15 | 0.84 | – | 124 | – | – | – | – |
| Bukowiecki et al. | 2012 | – | – | – | – | – | 312 | – | – |
| Bukowiecki et al. | 2011 | 1.71(1) | 0.00 | – | 631 | – | – | – | – |
| van den Bergh | 2006 | 1.76 | 0.74 | – | 78 | – | – | – | – |
| Dias et al. | 2002 | 1.76 | 0.74 | – | 78 | – | – | – | – |
(N): Indicates that there are N extra values assigned to this parameter in the corresponding reference.
Cavallo et al. (2024)
Gold sample.
Almeida et al. (2025)
Mass determination: intermediate fit. Isochrone match: good fit.