Bochum 14
0.81
UTI
0.79
CN
1.0
Cdens
1.0
CC3
0.65
Clit
0.99
Cdup
Nm (P>50%)
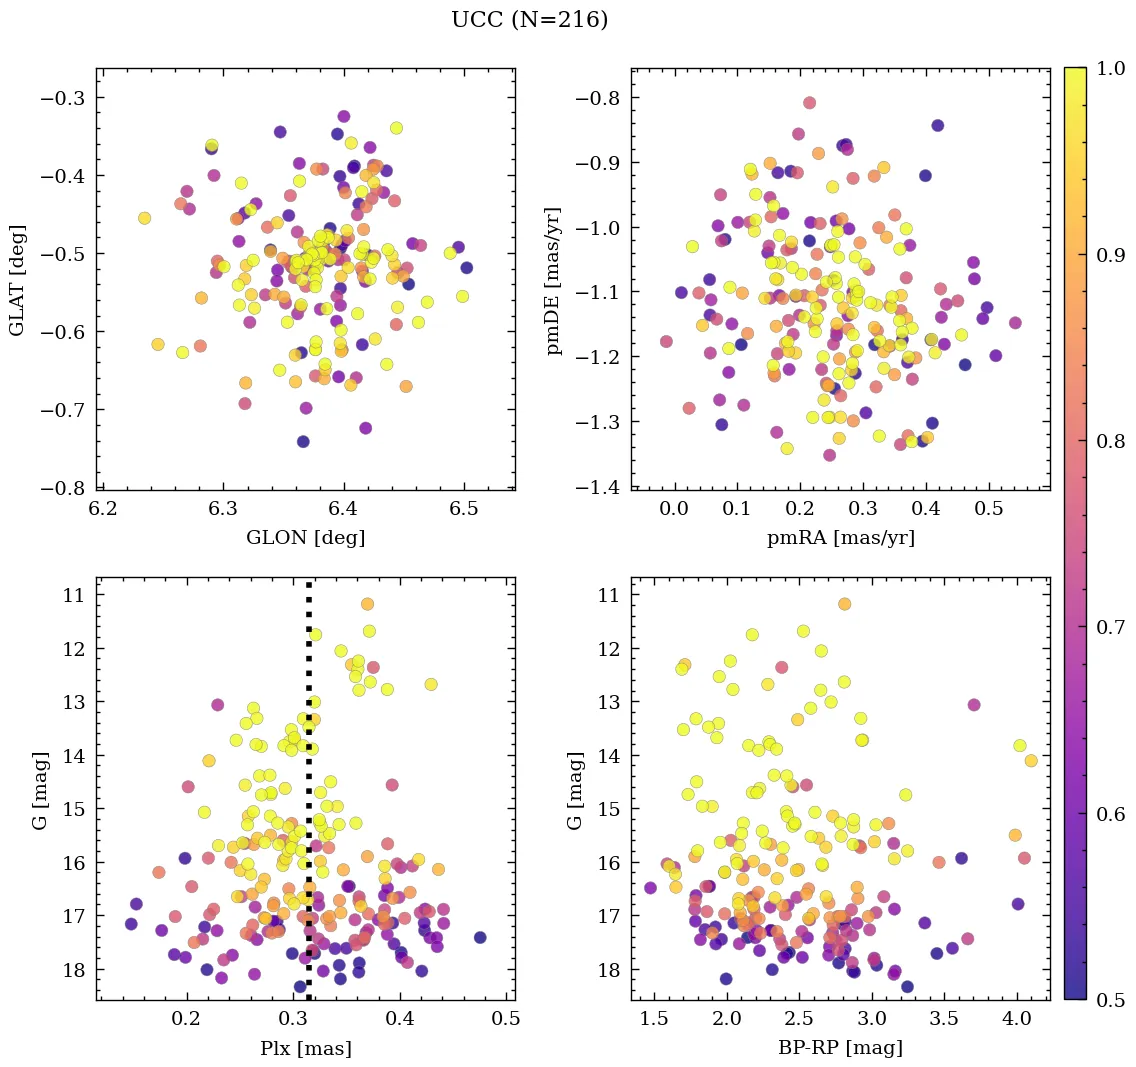
216
Core radius and density
1.5 [pc], 6.8 [pc-2]
- CN 0.79 Rich
- Cdens 1.0 Very dense
- CC3 1.0 Very high quality
- Clit 0.65 Moderately studied
- Cdup 0.99 Unique
 MOCA
MOCA
Overview
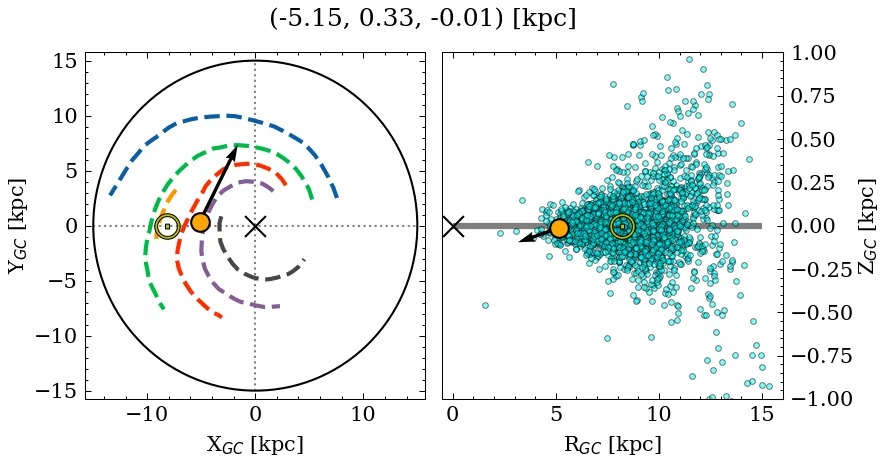
Bochum 14 is a rich, very dense object of very high C3 quality. Its parallax locates it at a moderate* distance, near the mid-plane, affected by high extinction. It is catalogued as a massive, near-solar metallicity, very young cluster (see Parameters). It is moderately studied in the literature.
(*): The parallax distance estimate (~3.18 kpc) differs significantly from the median photometric distance (~0.70 kpc).
Note: This is a unique object, which shares a very small percentage of members with at least one previously reported entry. See table with shared members information.
Data
| Reference | Year | RA [deg] | DEC [deg] | Plx [mas] | pmRA [mas/yr] | pmDE [mas/yr] | Rv [km/s] |
|---|---|---|---|---|---|---|---|
| UCC | 99999– | 270.502 | -23.699 | 0.314 | 0.253 | -1.121 | 110.242 |
| Hunt & Reffert | 2024 | 270.5 | -23.697 | 0.313 | 0.25 | -1.117 | 57.733 |
| Cavallo et al. | 2024 | 270.523 | -23.695 | 0.313 | – | – | – |
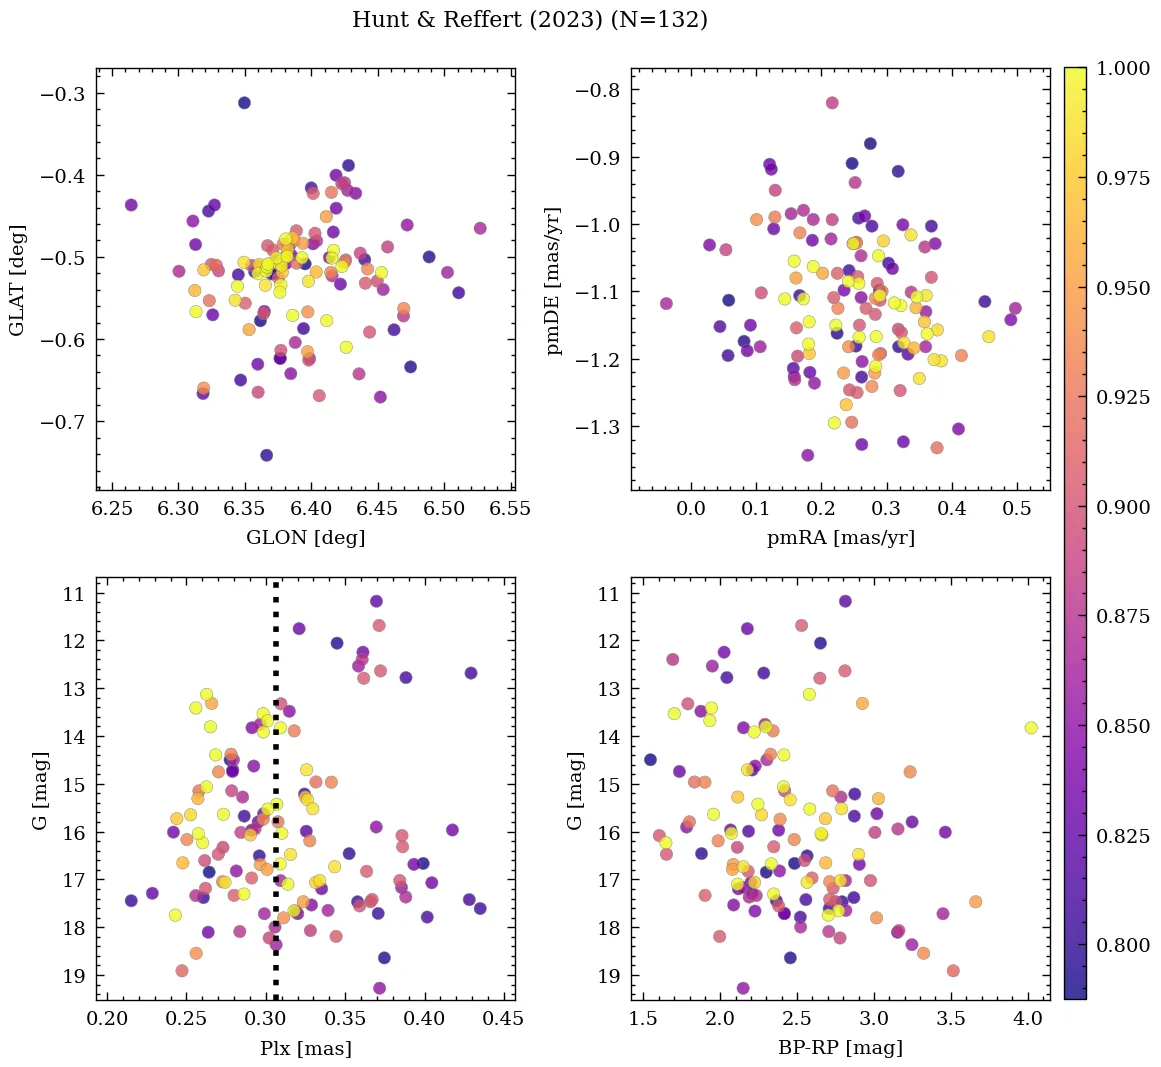
| Hunt & Reffert | 2023 | 270.5 | -23.697 | 0.313 | 0.25 | -1.117 | 57.733 |
| Jaehnig et al. | 2021 | 270.517 | -23.698 | 0.311 | 0.251 | -1.063 | – |
| Sánchez et al. | 2020 | 270.5 | -23.683 | – | 0.351 | -1.167 | – |
| Loktin & Popova | 2017 | 270.495 | -23.684 | – | -1.75 | -1.63 | – |
| Sampedro et al. | 2017 | 270.5 | -23.683 | – | -0.22 | -1.34 | – |
| Joshi et al. | 2016 | 270.498 | -23.705 | – | – | – | – |
| Dias et al. | 2016 | 270.5 | -23.683 | – | -1.75 | -1.63 | – |
| Dias et al. | 2014 | 270.5 | -23.683 | – | 0.08 | -2.55 | – |
| Morales et al. | 2013 | 270.5 | -23.683 | – | – | – | – |
| Bukowiecki et al. | 2011 | 270.504 | -23.7 | – | – | – | – |
| Ahumada & Lapasset | 2007 | 270.5 | -23.683 | – | – | – | – |
| van den Bergh | 2006 | 270.5 | -23.7 | – | – | – | – |
| Dias et al. | 2002 | 270.5 | -23.683 | – | – | – | – |
| Dambis | 1999 | 270.5 | -23.7 | – | – | – | – |
| Lynga | 1987 | 270.492 | -23.699 | – | – | – | – |
💡 Note: The UCC values are estimated from its identified members.
| Reference | Year | Dist [kpc] | Av [mag] | DAv [mag] | Age [Myr] | [Fe/H] [dex] | Mass [Msun] | Bfrac | BSS |
|---|---|---|---|---|---|---|---|---|---|
| UCC | 99999– | 0.7 | 4.76 | 3.13 | 10 | 0.470 | 1737 | – | 0 |
| Hunt & Reffert | 2024 | 2.92 | 5.18 | 3.13 | 13 | – | 3287(1) | – | – |
| Cavallo et al. | 2024 | 3.18 | 5.13 | – | 6 | 0.470 | – | – | – |
| Hunt & Reffert | 2023 | 2.92 | 5.18 | 3.13 | 13 | – | – | – | – |
| Jaehnig et al. | 2021 | 3.08(1) | – | – | – | – | – | – | – |
| Loktin & Popova | 2017 | 0.66 | 4.76 | – | 10 | – | – | – | – |
| Joshi et al. | 2016 | 0.54 | 5.85 | – | 13 | – | – | – | – |
| Dias et al. | 2016 | 0.58 | 4.76 | – | 10 | – | – | – | – |
| Morales et al. | 2013 | 0.97 | – | – | 10 | – | – | – | – |
| Bukowiecki et al. | 2012 | – | – | – | – | – | 187 | – | – |
| Bukowiecki et al. | 2011 | 0.62(1) | 3.60 | – | 16 | – | – | – | – |
| Ahumada & Lapasset | 2007 | – | 4.76 | – | 10 | – | – | – | 0 |
| van den Bergh | 2006 | 0.58 | 4.76 | – | 10 | – | – | – | – |
| Dias et al. | 2002 | 0.58 | 4.76 | – | 10 | – | – | – | – |
| Dambis | 1999 | 0.70 | 4.94 | – | 8 | – | – | – | – |
| Lynga | 1987 | 1.15 | – | – | 1 | – | – | – | – |
(N): Indicates that there are N extra values assigned to this parameter in the corresponding reference.
Cavallo et al. (2024)
Bronze sample.
Hunt & Reffert (2024)
Classified as open cluster. CMD class: 0.02 (50th percentile).
Hunt & Reffert (2023)
Classified as open cluster. CMD class: 0.02 (50th percentile).
Morales et al. (2013)
Classified as morphological type 'OC2' (totally exposed cluster without correlation with ATLASGAL emission). Morphological flag: exposed cluster, without submm emission.