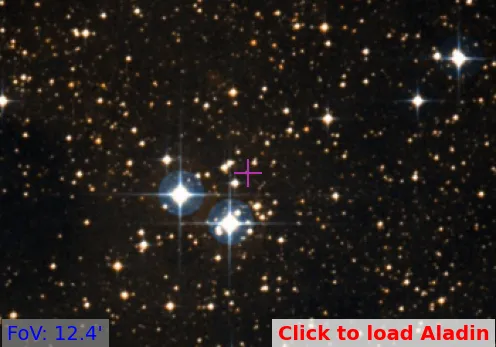
Bochum 13
(MWSC 2559)
0.90
UTI
0.75
CN
1.0
Cdens
0.75
CC3
1.0
Clit
1.0
Cdup
Stellar density (N50/rad)
10.1 [N/pc2]
- CN 0.75 Rich
- Cdens 1.0 Very dense
- CC3 0.75 High quality
- Clit 1.0 Very well-studied
- Cdup 1.0 Unique
 MOCA
MOCA
Overview
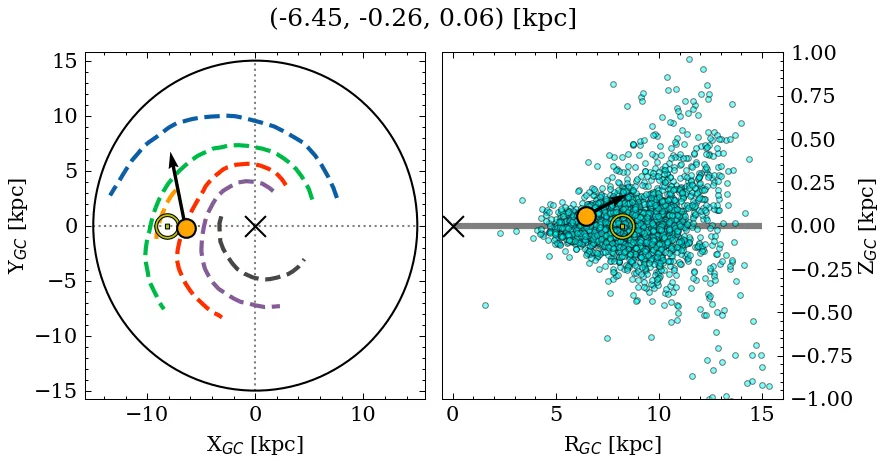
Bochum 13 is a rich, very dense object of high C3 quality. Its parallax locates it at a relatively close* distance, above the mid-plane, affected by moderate extinction. It is catalogued as a near-solar metallicity, very young cluster, but with a large variance across recent sources for the metallicity and mass parameters (see Parameters). It is very well-studied in the literature.
(*): The parallax distance estimate (~1.76 kpc) differs significantly from the median photometric distance (~1.34 kpc).
Note: This object shares a very small percentage of members with a later reported entry. See table with shared members information.
Data
| Reference | Year | RA [deg] | DEC [deg] | Plx [mas] | pmRA [mas/yr] | pmDE [mas/yr] | Rv [km/s] |
|---|---|---|---|---|---|---|---|
| UCC | 99999– | 259.336 | -35.533 | 0.569 | -0.281 | -1.255 | -62.148 |
| Almeida et al. | 2025 | 259.324 | -35.535 | – | – | – | – |
| Hunt & Reffert | 2024 | 259.333 | -35.534 | 0.57 | -0.255 | -1.295 | -28.177 |
| Celli et al. | 2024 | 259.333 | -35.529 | – | – | – | – |
| Cavallo et al. | 2024 | 259.347 | -35.588 | 0.572 | – | – | – |
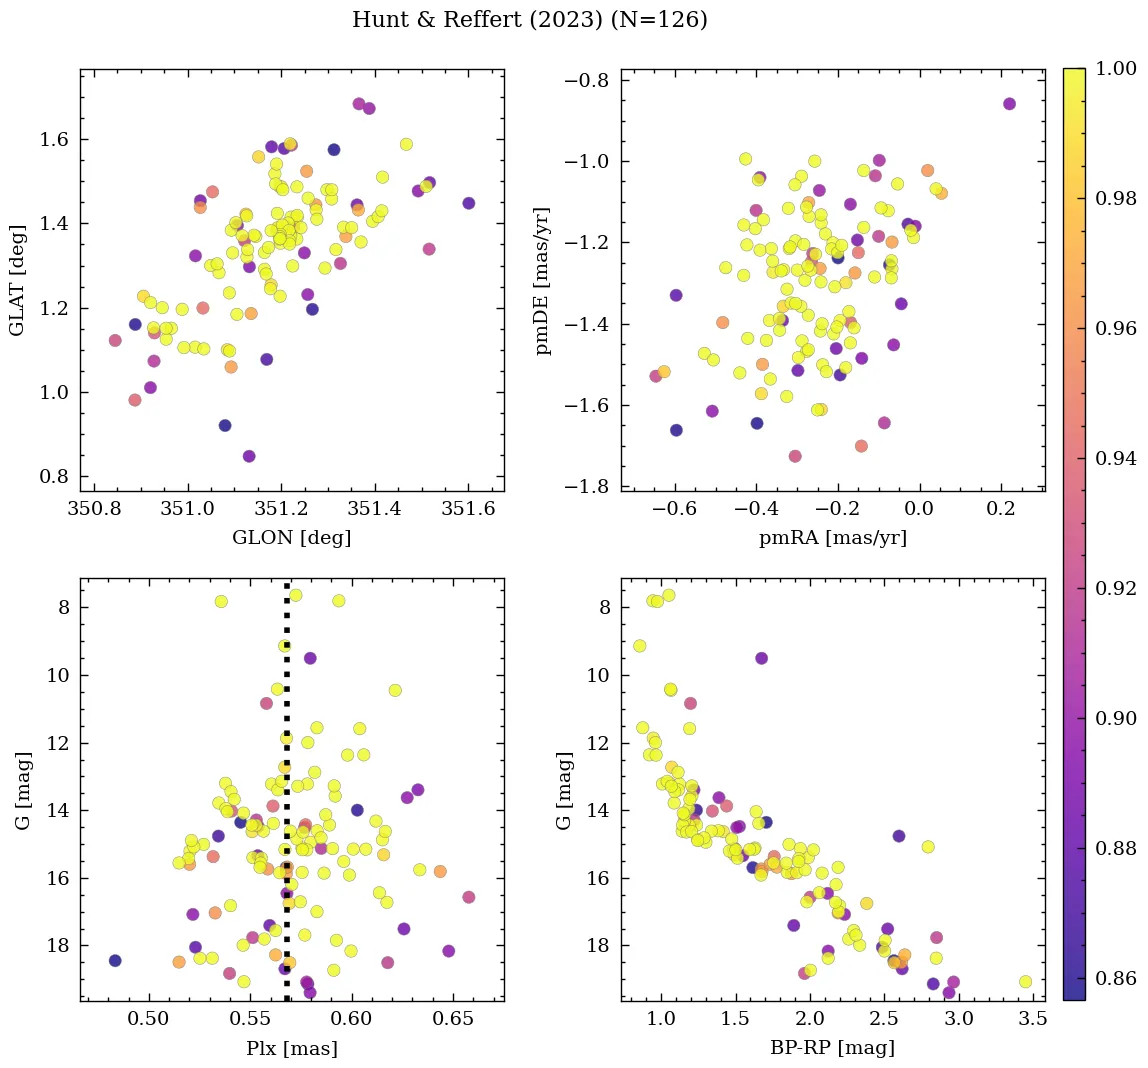
| Hunt & Reffert | 2023 | 259.333 | -35.534 | 0.57 | -0.255 | -1.295 | -28.177 |
| Just et al. | 2023 | 259.321 | -35.55 | – | – | – | – |
| Richer et al. | 2021 | 259.345 | -35.51 | 0.559 | -0.296 | -1.29 | – |
| Dias et al. | 2021 | 259.324 | -35.535 | 0.57 | -0.282 | -1.276 | – |
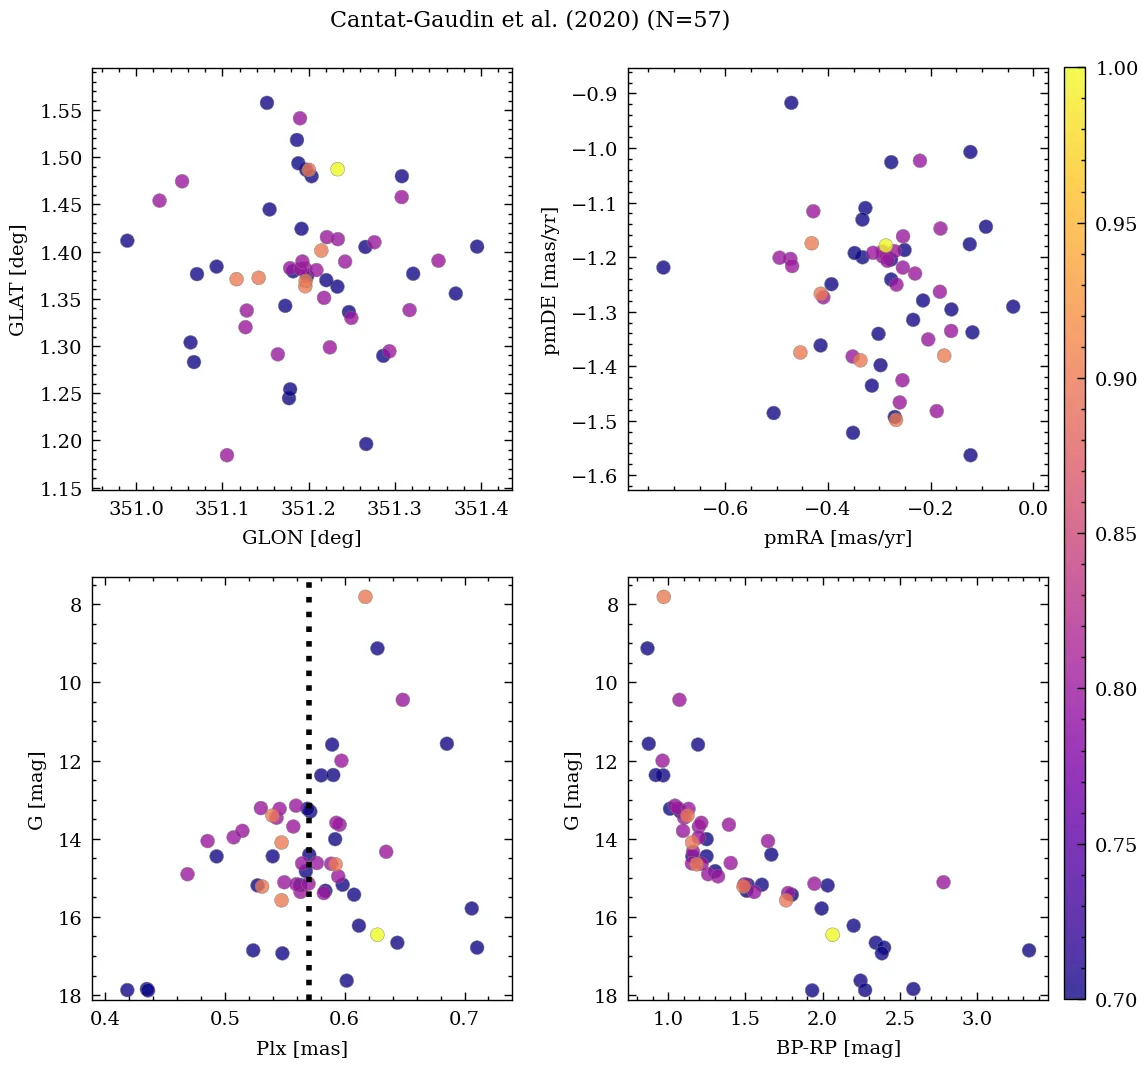
| Cantat-Gaudin et al. | 2020 | 259.333 | -35.529 | 0.567 | -0.286 | -1.284 | – |
| Sánchez et al. | 2020 | 259.35 | -35.55 | – | -0.215 | -1.28 | – |
| Cantat-Gaudin & Anders | 2020 | 259.333 | -35.529 | 0.567 | -0.286 | -1.284 | – |
| Soubiran et al. | 2018 | 259.333 | -35.529 | – | – | – | -20.76 |
| Cantat-Gaudin et al. | 2018 | 259.333 | -35.529 | 0.567 | -0.286 | -1.284 | – |
| Loktin & Popova | 2017 | 259.35 | -35.551 | – | 0.643 | -5.067 | -2.5 |
| Kharchenko et al. | 2016 | 259.321 | -35.55 | – | – | – | – |
| Dias et al. | 2014 | 259.35 | -35.55 | – | -1.72 | -1.94 | – |
| Kharchenko et al. | 2013 | 259.33 | -35.55 | – | -0.6 | -2.19 | -2.5 |
| Morales et al. | 2013 | 259.35 | -35.55 | – | – | – | – |
| Gozha et al. | 2012 | 259.35 | -35.55 | – | – | – | – |
| Bukowiecki et al. | 2011 | 259.317 | -35.542 | – | – | – | – |
| Piskunov et al. | 2008 | 259.339 | -35.545 | – | – | – | – |
| Kharchenko et al. | 2007 | 259.35 | -35.55 | – | 0.18 | – | -2.5 |
| van den Bergh | 2006 | 259.35 | -35.55 | – | – | – | – |
| Kharchenko et al. | 2005 | 259.35 | -35.55 | – | -0.28 | -1.2 | -2.5 |
| Kharchenko et al. | 2003 | 259.33 | -35.54 | – | -1.4 | -2.01 | – |
| Dias et al. | 2002 | 259.35 | -35.55 | – | 0.26 | -1.56 | -1.93 |
| Dambis | 1999 | 259.35 | -35.55 | – | – | – | – |
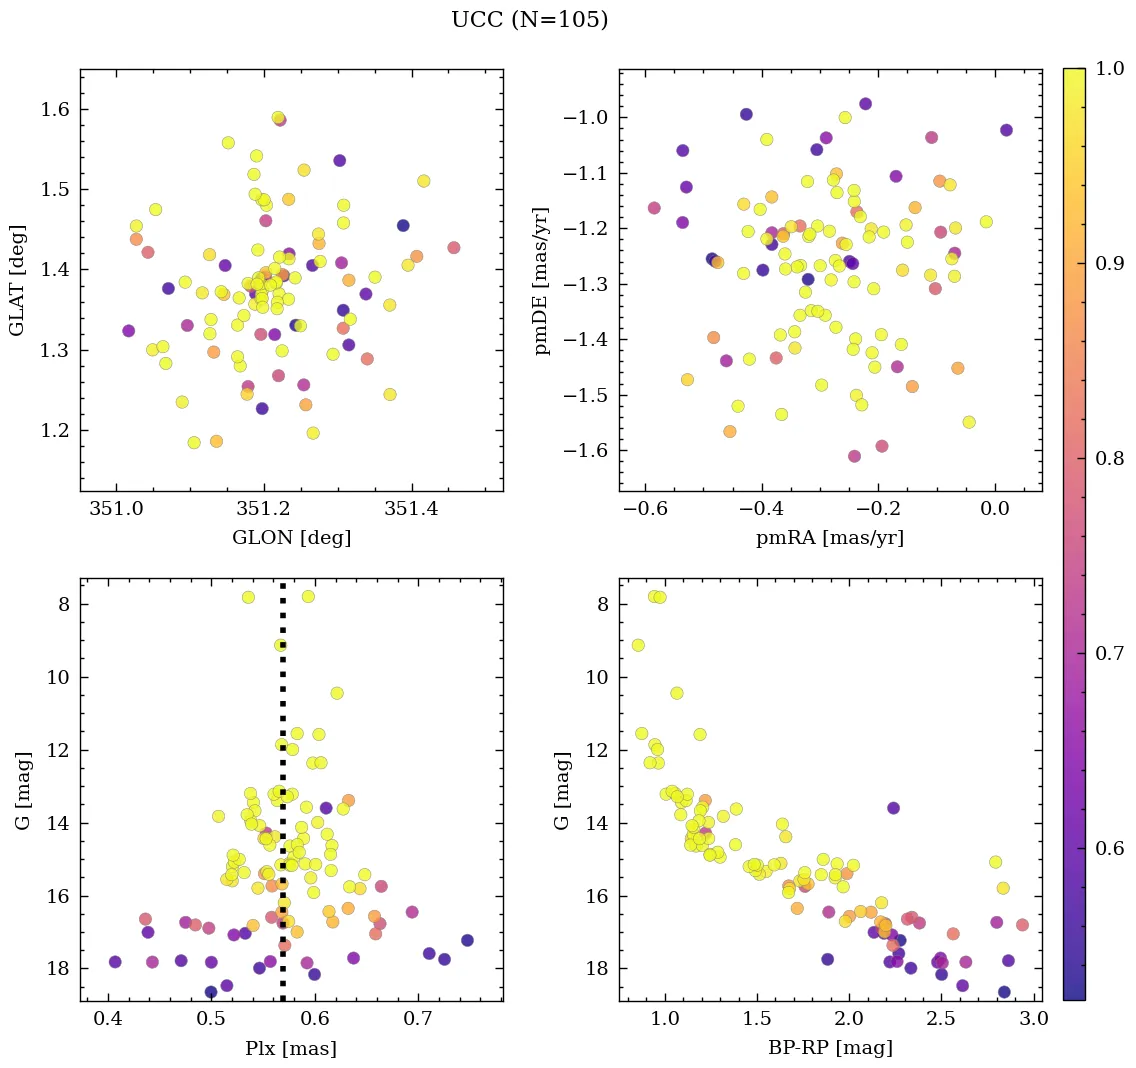
💡 Note: The UCC values are estimated from its identified members.
| Reference | Year | Dist [kpc] | Av [mag] | DAv [mag] | Age [Myr] | [Fe/H] [dex] | Mass [Msun] | Bfrac | BSS |
|---|---|---|---|---|---|---|---|---|---|
| UCC | 99999– | 1.34 | 2.56 | 1.89 | 9 | 0.135 | 500 | – | – |
| Almeida et al. | 2025 | 1.61 | 2.50 | – | 9 | – | 505 | – | – |
| Hunt & Reffert | 2024 | – | – | – | – | – | 1353(1) | – | – |
| Celli et al. | 2024 | – | – | – | 9 | – | 494 | – | – |
| Cavallo et al. | 2024 | 1.52 | 2.88 | – | 9 | -0.030 | – | – | – |
| Hunt & Reffert | 2023 | 1.65 | 2.94 | 1.89 | 5 | – | – | – | – |
| Just et al. | 2023 | – | – | – | 18 | – | 127 | – | – |
| Richer et al. | 2021 | – | 2.63 | – | – | – | – | – | – |
| Dias et al. | 2021 | 1.61 | 2.50 | – | 9 | 0.299 | – | – | – |
| Cantat-Gaudin et al. | 2020 | 1.67 | 2.63 | – | 9 | – | – | – | – |
| Cantat-Gaudin & Anders | 2020 | 1.68 | – | – | – | – | – | – | – |
| Soubiran et al. | 2018 | 1.68 | – | – | – | – | – | – | – |
| Cantat-Gaudin et al. | 2018 | 1.68 | – | – | – | – | – | – | – |
| Loktin & Popova | 2017 | 1.10 | 2.57 | – | 10 | – | – | – | – |
| Kharchenko et al. | 2016 | 1.34 | 2.55 | – | 18 | – | – | – | – |
| Kharchenko et al. | 2013 | 1.34 | 2.55 | – | 18 | – | – | – | – |
| Morales et al. | 2013 | 1.08 | – | – | 7 | – | – | – | – |
| Bukowiecki et al. | 2012 | – | – | – | – | – | 1407 | – | – |
| Gozha et al. | 2012 | 1.08 | – | – | 7 | – | 302 | – | – |
| Bukowiecki et al. | 2011 | 2.64(1) | 2.60 | – | 7 | – | – | – | – |
| Piskunov et al. | 2008 | 1.08 | 2.45 | – | 12 | – | – | – | – |
| van den Bergh | 2006 | 1.08 | 2.63 | – | 7 | – | – | – | – |
| Kharchenko et al. | 2005 | 1.08 | 2.45 | – | 12 | – | – | – | – |
| Kharchenko et al. | 2003 | 1.08 | 2.48 | – | – | – | – | – | – |
| Dias et al. | 2002 | 1.08 | 2.65 | – | 7 | – | – | – | – |
| Dambis | 1999 | 1.27 | 2.49 | – | 3 | – | – | – | – |
(N): Indicates that there are N extra values assigned to this parameter in the corresponding reference.
Palma et al. (2025)
Part of multiple system G17, along with HSC_2897, NGC_6334 and CWNU_1832.
Morales et al. (2013)
Classified as morphological type 'OC2' (totally exposed cluster without correlation with ATLASGAL emission). Morphological flag: exposed cluster, without submm emission.
Cavallo et al. (2024)
Gold sample.
Almeida et al. (2025)
Mass determination: good fit. Isochrone match: intermediate fit. Silver sample.