Berkeley 73
(MWSC 847; OCL 546)
0.75
UTI
0.76
CN
0.59
Cdens
0.75
CC3
0.83
Clit
1.0
Cdup
Nm (P>50%)
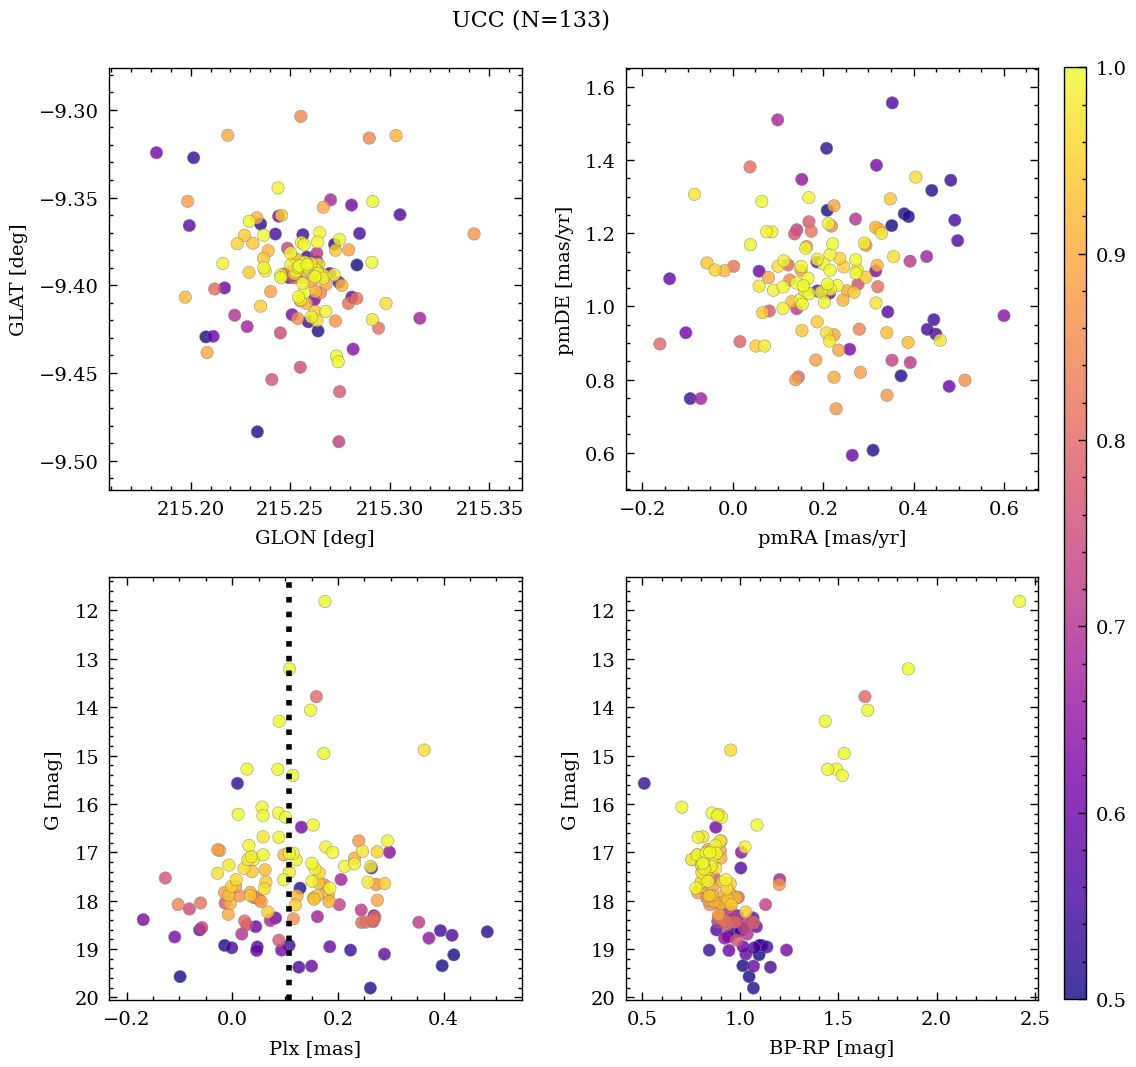
133
Core radius and density
2.0 [pc], 2.9 [pc-2]
- CN 0.76 Rich
- Cdens 0.59 Moderately dense
- CC3 0.75 High quality
- Clit 0.83 Well-studied
- Cdup 1.0 Unique
 MOCA
MOCA
Overview
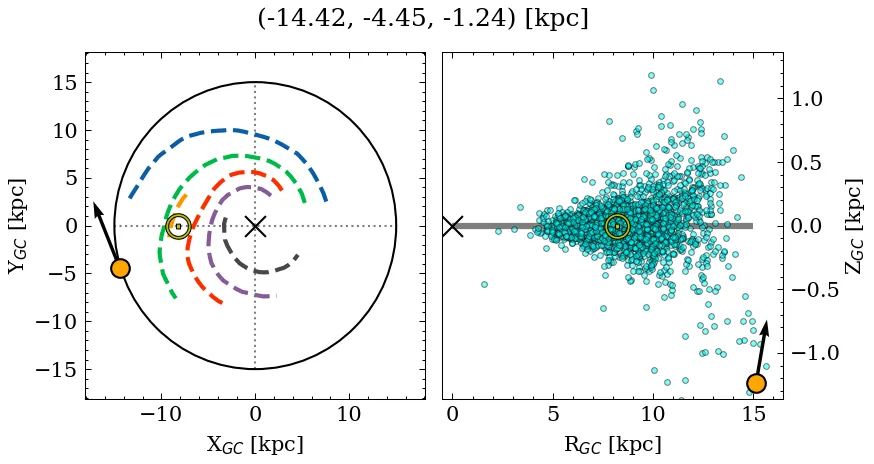
Berkeley 73 is a rich, moderately dense object of high C3 quality. Its parallax locates it at a large* distance, well below the mid-plane, affected by low extinction. It is catalogued as a near-solar metallicity, old cluster, but with a large variance across recent sources for the mass parameter (see Parameters). It is well-studied in the literature.
(*): The parallax distance estimate (~9.26 kpc) differs significantly from the median photometric distance (~6.35 kpc).
Data
| Reference | Year | RA [deg] | DEC [deg] | Plx [mas] | pmRA [mas/yr] | pmDE [mas/yr] | Rv [km/s] |
|---|---|---|---|---|---|---|---|
| UCC | 99999– | 95.52 | -6.318 | 0.108 | 0.212 | 1.076 | 96.515 |
| Li et al. | 2025 | 95.52 | -6.321 | 0.128 | 0.227 | 1.11 | – |
| Hu & Soubiran | 2025 | 95.517 | -6.306 | – | – | – | – |
| Almeida et al. | 2025 | 95.516 | -6.328 | – | – | – | – |
| Hunt & Reffert | 2024 | 95.52 | -6.319 | 0.122 | 0.214 | 1.012 | 94.289 |
| Cavallo et al. | 2024 | 95.517 | -6.307 | 0.115 | – | – | – |
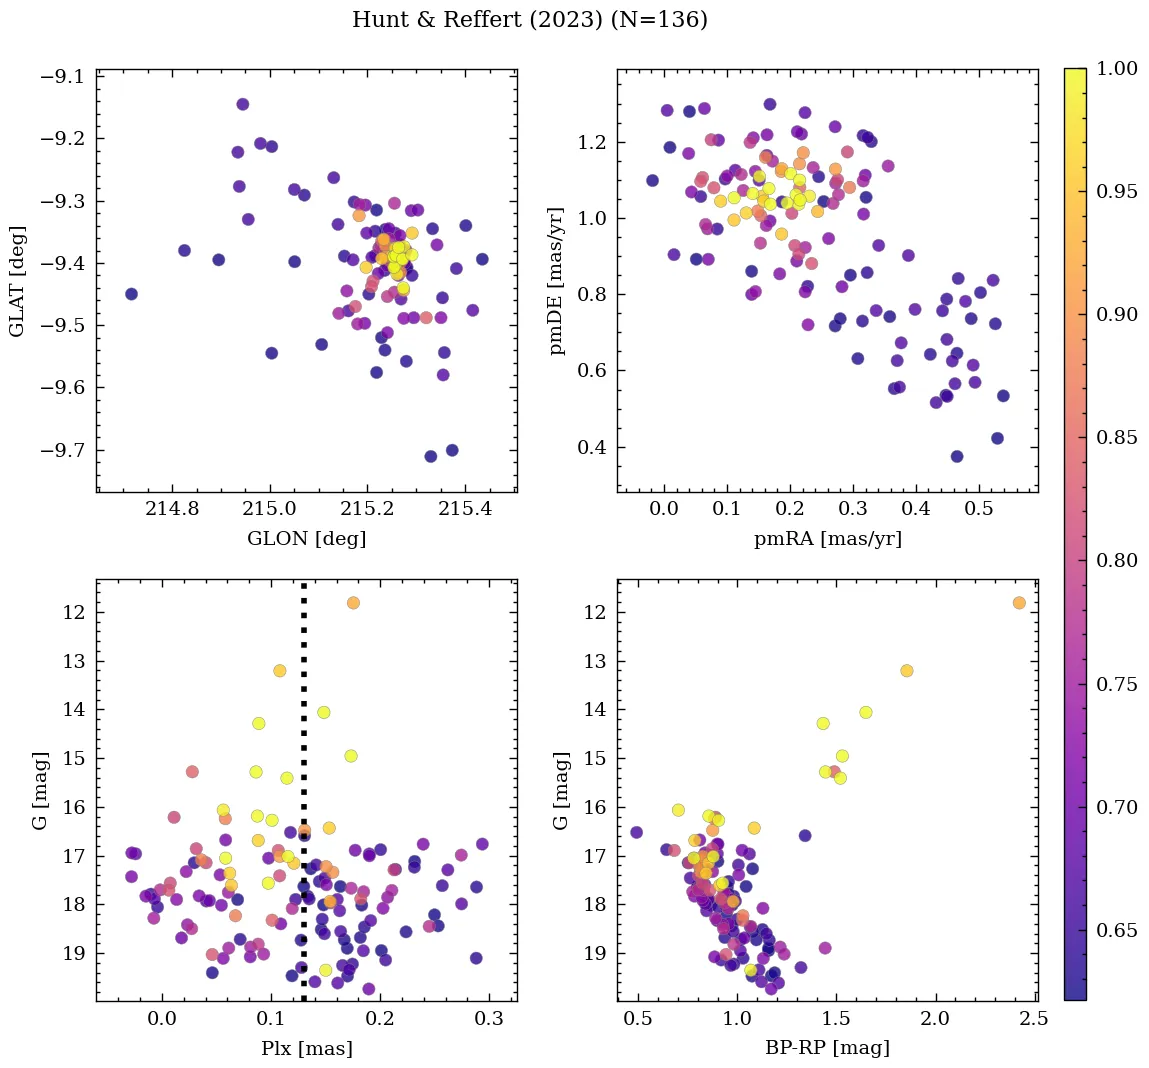
| Hunt & Reffert | 2023 | 95.52 | -6.319 | 0.122 | 0.214 | 1.012 | 94.289 |
| Just et al. | 2023 | 95.509 | -6.318 | – | – | – | – |
| Perren et al. | 2022 | 95.52 | -6.321 | – | – | – | – |
| Jadhav & Subramaniam | 2021 | 95.52 | -6.321 | – | – | – | – |
| Netopil et al. | 2022 | 95.5 | -6.35 | – | – | – | 97.51 |
| Dias et al. | 2021 | 95.516 | -6.328 | 0.12 | 0.2 | 1.065 | – |
| Spina et al. | 2021 | 95.52 | -6.322 | 0.138 | 0.251 | 1.087 | – |
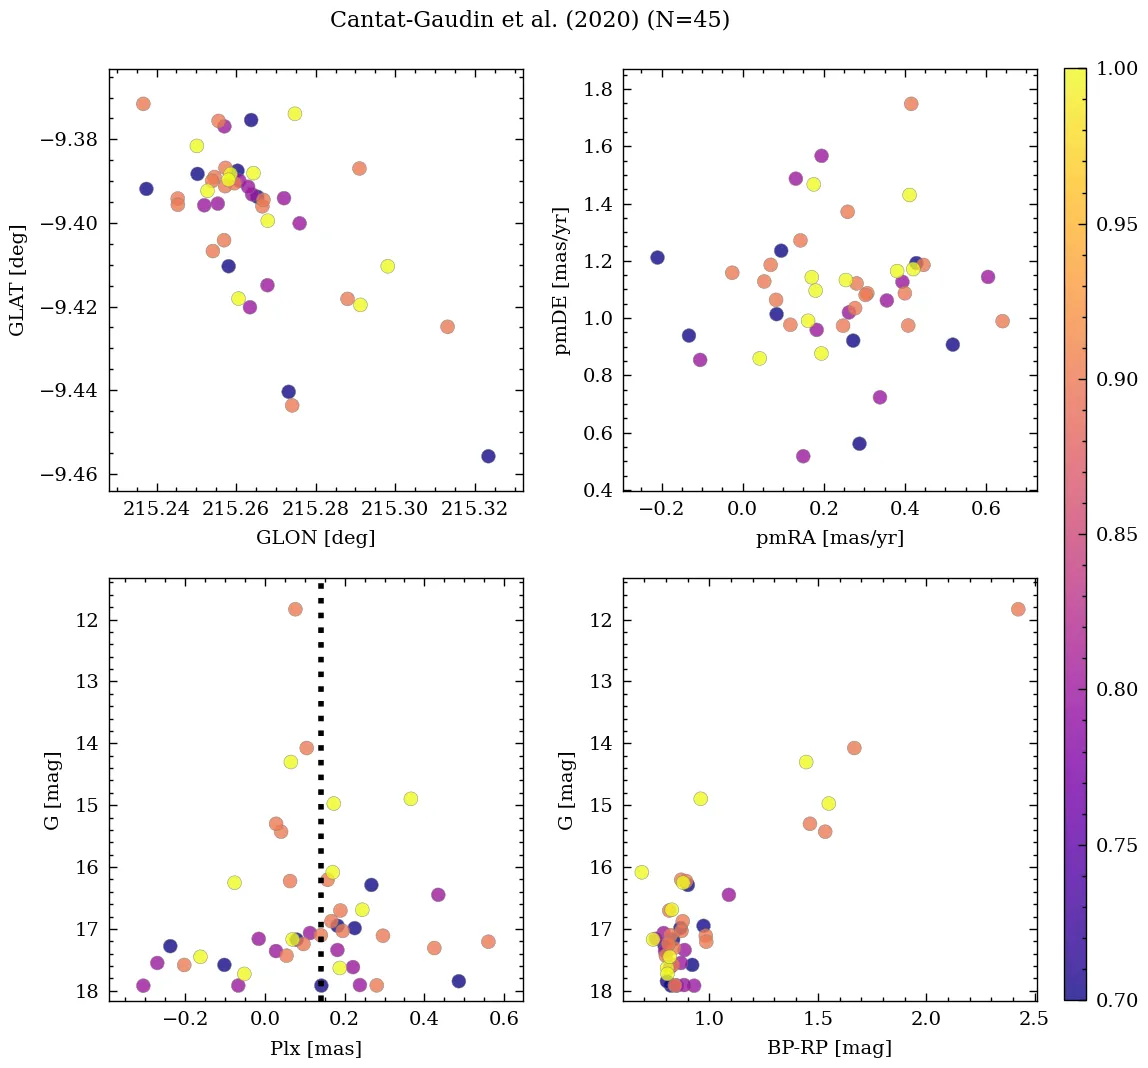
| Cantat-Gaudin et al. | 2020 | 95.52 | -6.321 | 0.128 | 0.227 | 1.11 | – |
| Cantat-Gaudin & Anders | 2020 | 95.52 | -6.321 | 0.128 | 0.227 | 1.11 | – |
| Soubiran et al. | 2018 | 95.52 | -6.321 | – | – | – | 96.97 |
| Bica et al. | 2019 | 95.522 | -6.319 | – | – | – | – |
| Cantat-Gaudin et al. | 2018 | 95.52 | -6.321 | 0.128 | 0.227 | 1.11 | – |
| Dias et al. | 2016 | 95.5 | -6.35 | – | 3.47 | -1.72 | 95.7 |
| Kharchenko et al. | 2016 | 95.509 | -6.318 | – | – | – | – |
| Netopil et al. | 2016 | 95.525 | -6.317 | – | – | – | – |
| Kharchenko et al. | 2013 | 95.515 | -6.319 | – | 3.47 | -1.72 | 95.7 |
| Gozha et al. | 2012 | 95.5 | -6.35 | – | – | – | – |
| Bukowiecki et al. | 2011 | 95.525 | -6.323 | – | – | – | – |
| Dias et al. | 2002 | 95.5 | -6.35 | – | – | – | – |
| Lynga | 1987 | 95.513 | -6.346 | – | – | – | – |
| Alter et al. | 1970 | 95.513 | -6.346 | – | – | – | – |
💡 Note: The UCC values are estimated from its identified members.
| Reference | Year | Dist [kpc] | Av [mag] | DAv [mag] | Age [Myr] | [Fe/H] [dex] | Mass [Msun] | Bfrac | BSS |
|---|---|---|---|---|---|---|---|---|---|
| UCC | 99999– | 6.35 | 0.675 | 1.38 | 1513 | -0.310 | 810 | 0.53 | 0 |
| Li et al. | 2025 | 6.45 | 1.20 | – | 1513 | -0.371 | – | – | – |
| Hu & Soubiran | 2025 | – | – | – | – | -0.400(5) | – | – | – |
| Almeida et al. | 2025 | 5.83 | 0.86 | – | 2223 | – | 524 | – | – |
| Hunt & Reffert | 2024 | 6.82 | 0.61 | 1.38 | 1343 | – | 972(1) | – | – |
| Cavallo et al. | 2024 | 4.85 | 1.06 | – | 2512 | -0.510 | – | – | – |
| Hunt & Reffert | 2023 | 6.82 | 0.61 | 1.38 | 1343 | – | – | – | – |
| Just et al. | 2023 | – | – | – | 1413 | – | 612 | – | – |
| Perren et al. | 2022 | 5.50 | 0.50 | – | 3981 | -0.410 | 3300 | 0.53 | – |
| Spina et al. | 2022 | – | – | – | – | -0.310 | – | – | – |
| Jadhav & Subramaniam | 2021 | 6.17 | 0.69 | – | 1413 | – | 810 | – | 0(1) |
| Netopil et al. | 2022 | 7.24(1) | – | – | 1585 | -0.230(1) | – | – | – |
| Dias et al. | 2021 | 5.83 | 0.86 | – | 2223 | -0.226 | – | – | – |
| Spina et al. | 2021 | 4.33 | – | – | 1413 | -0.319(20) | – | – | – |
| Cantat-Gaudin et al. | 2020 | 6.17 | 0.69 | – | 1413 | – | – | – | – |
| Kounkel et al. | 2020 | 5.10 | 0.89 | – | 1380 | – | – | – | – |
| Cantat-Gaudin & Anders | 2020 | 6.35 | – | – | – | – | – | – | – |
| Soubiran et al. | 2018 | 6.35 | – | – | – | – | – | – | – |
| Cantat-Gaudin et al. | 2018 | 6.35 | – | – | – | – | – | – | – |
| Dias et al. | 2016 | 9.80 | 0.35 | – | 1514 | -0.220 | – | – | – |
| Kharchenko et al. | 2016 | 7.88 | 0.66 | – | 1413 | – | – | – | – |
| Netopil et al. | 2016 | 15.81 | – | – | 1710 | – | – | – | – |
| Kharchenko et al. | 2013 | 7.88 | 0.66 | – | 1413 | -0.220 | – | – | – |
| Gozha et al. | 2012 | 9.80 | – | – | 1514 | -0.220 | – | – | – |
| Bukowiecki et al. | 2011 | 9.36(1) | 0.22 | – | 1778 | – | – | – | – |
(N): Indicates that there are N extra values assigned to this parameter in the corresponding reference.
Almeida et al. (2025)
Mass determination: invalid due to poor quality CMD. Isochrone match: worst fit.
Cavallo et al. (2024)
Gold sample.
Hunt & Reffert (2024)
Classified as open cluster. CMD class: 0.99 (50th percentile).
Hunt & Reffert (2023)
Classified as open cluster. CMD class: 0.99 (50th percentile).
Perren et al. (2022)
The CMD shows a main sequence and a well-defined TO followed by a giant branch that is somewhat redder than expected. Some stars above the TO are BSS candidates; no clear RC. ASteCA estimates a distance of 5.5 kpc and an age of 4 Gyr, which is closer and older than any of the four databases or prior studies (Ortolani 2005: 2.3 Gyr/6.5 kpc; Carraro 2005 and 2007: 1.5 Gyr/9.7–11.5 kpc). The closest match is Dias 2021 (5.8 kpc, 2.2 Gyr). This places the cluster well inside the 9 kpc limit.
Hu et al. (2021)
Ellipticities (core, all): e_core=0.2701, e_all=0.4099.