Berkeley 60
(MWSC 29; OCL 288)
0.92
UTI
0.83
CN
1.0
Cdens
0.75
CC3
1.0
Clit
1.0
Cdup
Stellar density (N50/rad)
20.6 [N/pc2]
- CN 0.83 Rich
- Cdens 1.0 Very dense
- CC3 0.75 High quality
- Clit 1.0 Very well-studied
- Cdup 1.0 Unique
 MOCA
MOCA
Overview
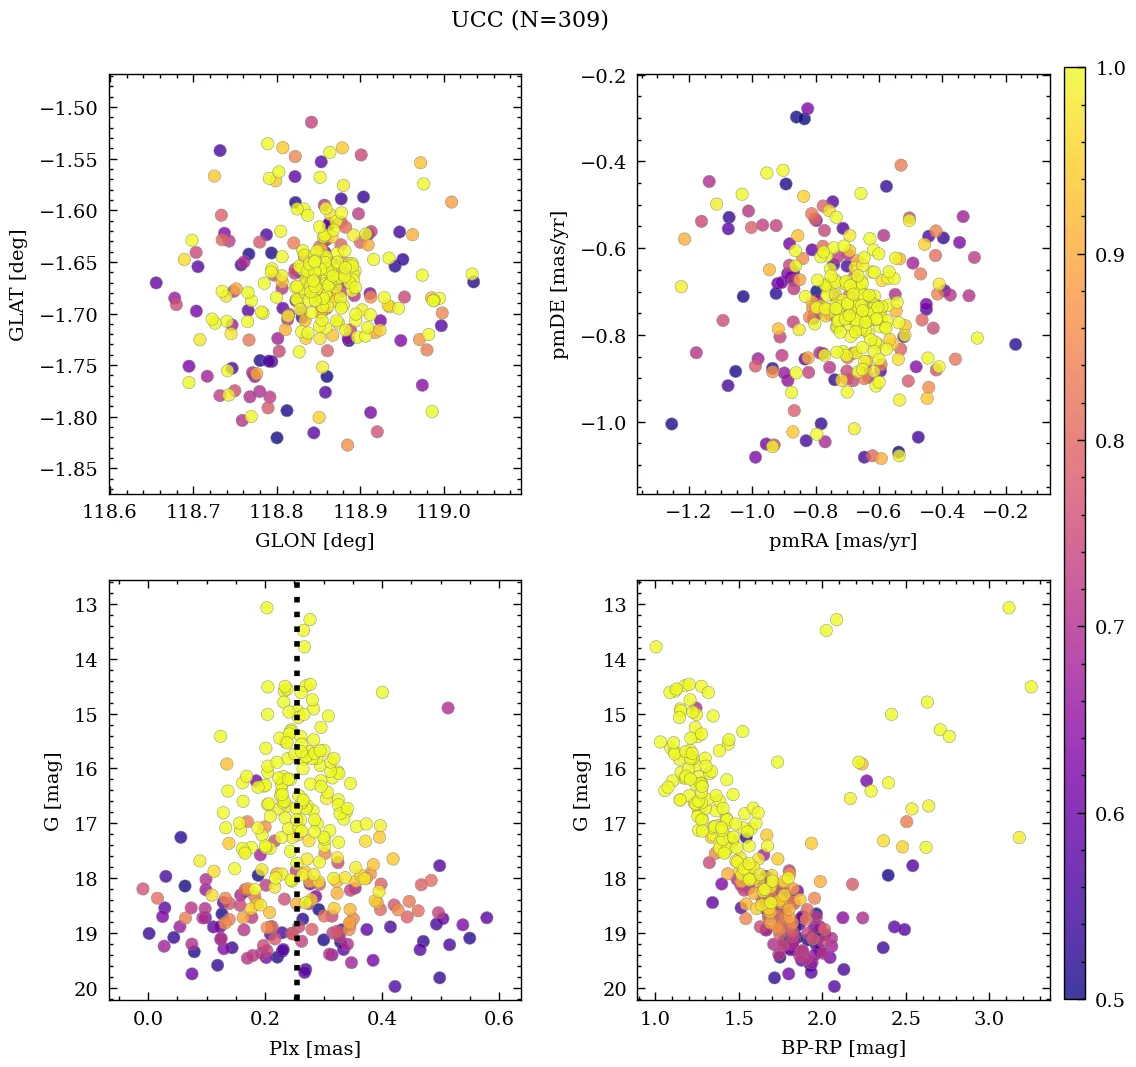
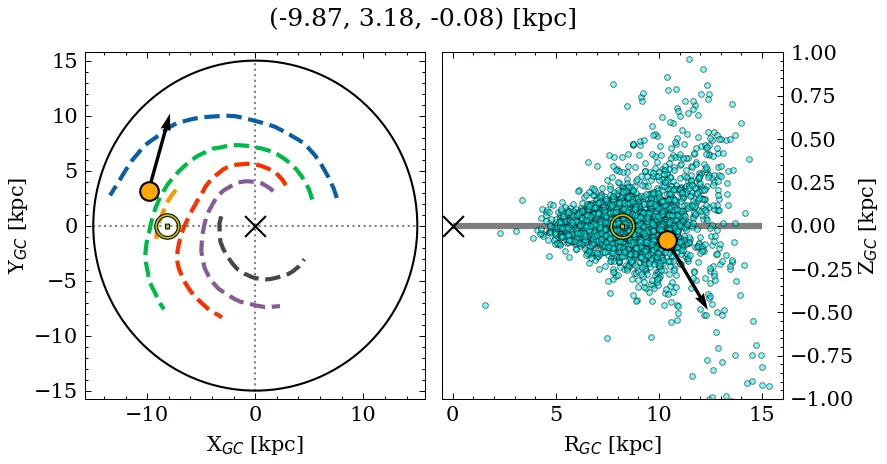
Berkeley 60 is a rich, very dense object of high C3 quality. Its parallax locates it at a moderate distance, below the mid-plane, affected by moderate extinction. It is catalogued as a near-solar metallicity, intermediate-age cluster, but with a large variance across recent sources for the age, metallicity, and mass parameters (see Parameters). It is very well-studied in the literature.
Note: This object shares a very small percentage of members with a later reported entry. See table with shared members information.
Data
| Reference | Year | RA [deg] | DEC [deg] | Plx [mas] | pmRA [mas/yr] | pmDE [mas/yr] | Rv [km/s] |
|---|---|---|---|---|---|---|---|
| UCC | 99999– | 4.438 | 60.935 | 0.255 | -0.69 | -0.737 | -63.433 |
| Hu & Soubiran | 2025 | 4.423 | 60.931 | – | – | – | – |
| Almeida et al. | 2025 | 4.442 | 60.934 | – | – | – | – |
| Hunt & Reffert | 2024 | 4.437 | 60.941 | 0.254 | -0.699 | -0.732 | -64.876 |
| Cavallo et al. | 2024 | 4.423 | 60.931 | 0.257 | – | – | – |
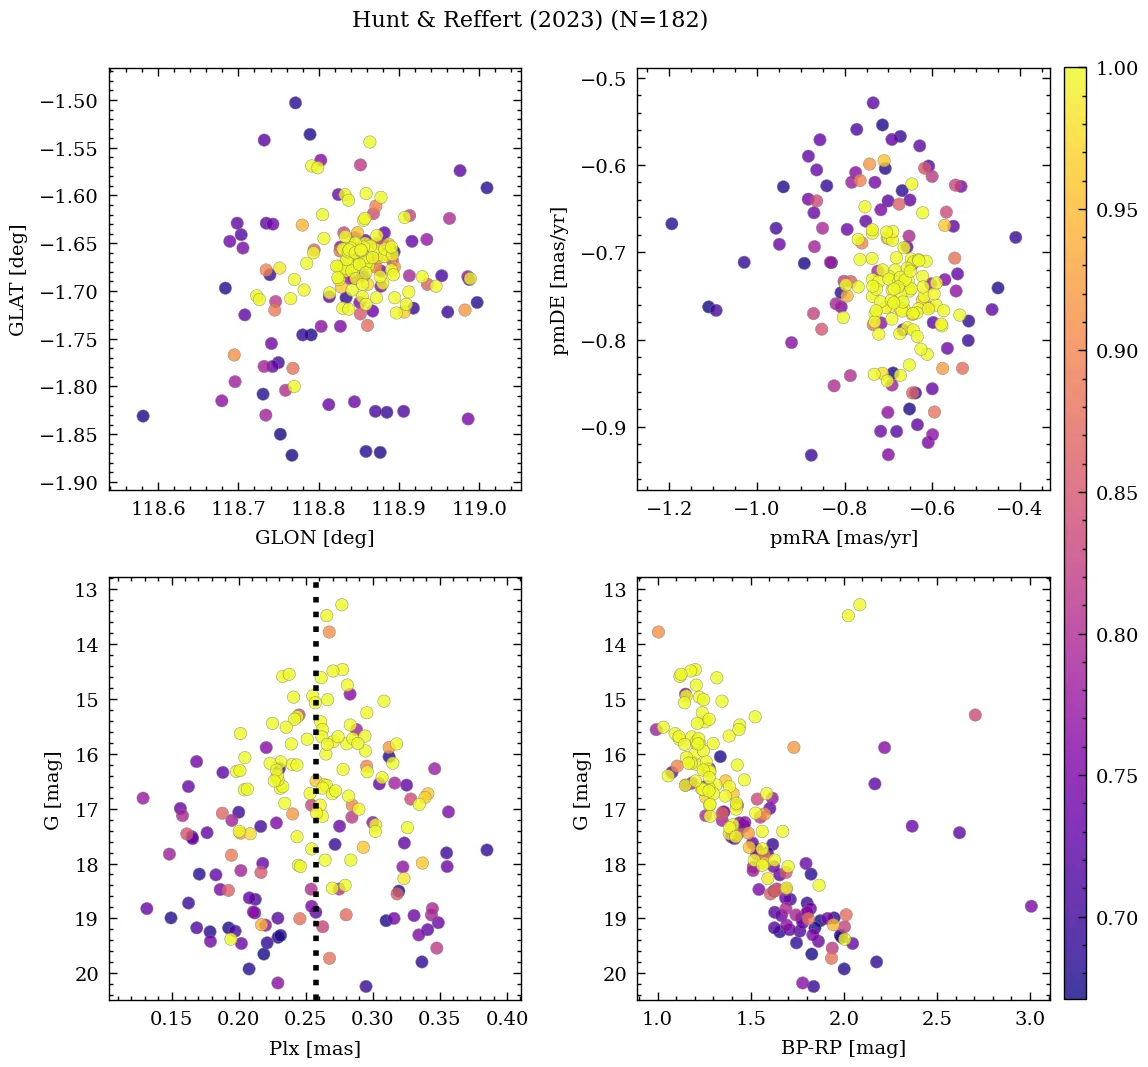
| Hunt & Reffert | 2023 | 4.437 | 60.941 | 0.254 | -0.699 | -0.732 | -64.876 |
| Almeida et al. | 2023 | 4.442 | 60.934 | – | – | – | – |
| Just et al. | 2023 | 4.416 | 60.93 | – | – | – | – |
| Jaehnig et al. | 2021 | 4.437 | 60.935 | 0.268 | -0.672 | -0.714 | – |
| Rain et al. | 2021 | 4.44 | 60.936 | 0.236 | -0.682 | -0.732 | – |
| Dias et al. | 2021 | 4.442 | 60.934 | 0.232 | -0.674 | -0.75 | -60.936 |
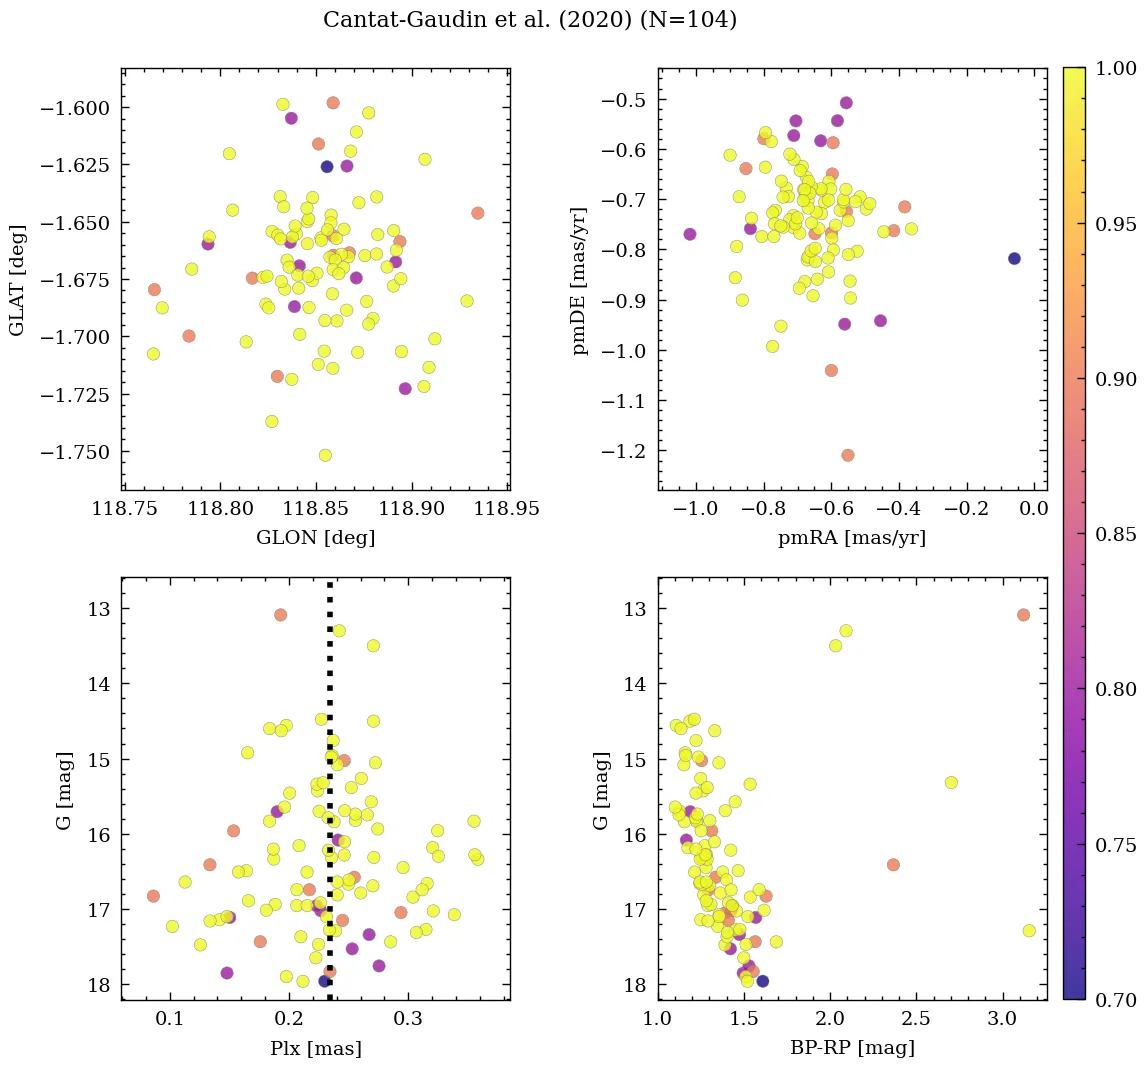
| Cantat-Gaudin et al. | 2020 | 4.44 | 60.936 | 0.236 | -0.682 | -0.732 | – |
| Sánchez et al. | 2020 | 4.425 | 60.933 | – | -0.629 | -0.682 | – |
| Cantat-Gaudin & Anders | 2020 | 4.44 | 60.936 | 0.236 | -0.682 | -0.732 | – |
| Soubiran et al. | 2018 | 4.44 | 60.936 | – | – | – | -60.66 |
| Bica et al. | 2019 | 4.414 | 60.943 | – | – | – | – |
| Cantat-Gaudin et al. | 2018 | 4.44 | 60.936 | 0.236 | -0.682 | -0.732 | – |
| Loktin & Popova | 2017 | 4.425 | 60.933 | – | -0.716 | -4.057 | – |
| Kharchenko et al. | 2016 | 4.416 | 60.93 | – | – | – | – |
| Dias et al. | 2014 | 4.425 | 60.933 | – | -3.64 | 0.2 | – |
| Kharchenko et al. | 2013 | 4.425 | 60.934 | – | -0.5 | -3.78 | – |
| Gozha et al. | 2012 | 4.425 | 60.934 | – | – | – | – |
| Kharchenko et al. | 2012 | 4.425 | 60.934 | – | -0.5 | -3.78 | – |
| Bukowiecki et al. | 2011 | 4.433 | 60.938 | – | – | – | – |
| van den Bergh | 2006 | 4.423 | 60.961 | – | – | – | – |
| Chen et al. | 2003 | 4.406 | 60.973 | – | – | – | – |
| Dias et al. | 2002 | 4.425 | 60.933 | – | -3.64 | 0.2 | – |
💡 Note: The UCC values are estimated from its identified members.
| Reference | Year | Dist [kpc] | Av [mag] | DAv [mag] | Age [Myr] | [Fe/H] [dex] | Mass [Msun] | Bfrac | BSS |
|---|---|---|---|---|---|---|---|---|---|
| UCC | 99999– | 3.71 | 2.67 | 1.65 | 251 | 0.070 | 493 | 0.62 | 0.0 |
| Hu & Soubiran | 2025 | – | – | – | – | -0.300(5) | – | – | – |
| Almeida et al. | 2025 | 2.92 | 2.48 | – | 676 | – | 675 | – | – |
| Hunt & Reffert | 2024 | – | – | – | – | – | 1694(1) | – | – |
| Cavallo et al. | 2024 | 3.27 | 2.35 | – | 617 | 0.490 | – | – | – |
| Hunt & Reffert | 2023 | 3.38 | 2.62 | 1.65 | 321 | – | – | – | – |
| Almeida et al. | 2023 | 3.06 | 2.65 | – | 383 | -0.179 | 493(1) | 0.62 | – |
| Just et al. | 2023 | – | – | – | 251 | – | 291 | – | – |
| Jaehnig et al. | 2021 | 3.70(1) | – | – | – | – | – | – | – |
| Rain et al. | 2021 | 3.78 | 2.67 | – | 158 | – | – | – | 0 |
| Dias et al. | 2021 | 2.92 | 2.48 | – | 676 | -0.167 | – | – | – |
| Cantat-Gaudin et al. | 2020 | 3.72 | 2.07 | – | 372 | – | – | – | – |
| Cantat-Gaudin & Anders | 2020 | 3.78 | – | – | – | – | – | – | – |
| Soubiran et al. | 2018 | 3.78 | – | – | – | – | – | – | – |
| Cantat-Gaudin et al. | 2018 | 3.78 | – | – | – | – | – | – | – |
| Loktin & Popova | 2017 | 2.01 | 1.41 | – | 1000 | – | – | – | – |
| Kharchenko et al. | 2016 | 3.30 | 2.97 | – | 251 | – | – | – | – |
| Kharchenko et al. | 2013 | 3.30 | 2.97 | – | 251 | 0.070 | – | – | – |
| Bukowiecki et al. | 2012 | – | – | – | – | – | 449 | – | – |
| Gozha et al. | 2012 | 4.37 | – | – | 158 | -0.350 | – | – | – |
| Kharchenko et al. | 2012 | 3.30 | 2.97 | – | 251 | 0.070 | – | – | – |
| Bukowiecki et al. | 2011 | 6.43(1) | 2.79 | – | 178 | – | – | – | – |
| van den Bergh | 2006 | 4.37 | 2.67 | – | 158 | – | – | – | – |
| Chen et al. | 2003 | 4.37 | 2.67 | – | 160 | 0.070(1) | – | – | – |
| Dias et al. | 2002 | 4.37 | 2.67 | – | 158 | 0.070 | – | – | – |
(N): Indicates that there are N extra values assigned to this parameter in the corresponding reference.
Cavallo et al. (2024)
Gold sample.
Almeida et al. (2025)
Mass determination: good fit. Isochrone match: good fit. Silver sample.