Berkeley 30
(MWSC 1034; Biurakan 9; OCL 534; FSR 1058)
0.91
UTI
0.78
CN
1.0
Cdens
0.75
CC3
1.0
Clit
1.0
Cdup
Stellar density (N50/rad)
24.4 [N/pc2]
- CN 0.78 Rich
- Cdens 1.0 Very dense
- CC3 0.75 High quality
- Clit 1.0 Very well-studied
- Cdup 1.0 Unique
 MOCA
MOCA
Overview
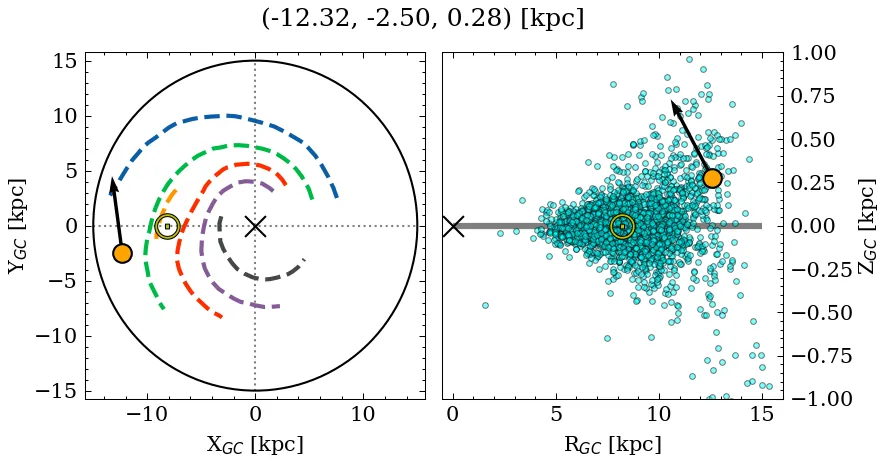
Berkeley 30 is a rich, very dense object of high C3 quality. Its parallax locates it at a large distance, above the mid-plane, affected by moderate extinction. It is catalogued as a massive, near-solar metallicity, intermediate-age cluster, but with a large variance across recent sources for the metallicity parameter (see Parameters). It is very well-studied in the literature.
Note: This object shares a small percentage of members with a later reported entry. See table with shared members information.
Data
| Reference | Year | RA [deg] | DEC [deg] | Plx [mas] | pmRA [mas/yr] | pmDE [mas/yr] | Rv [km/s] |
|---|---|---|---|---|---|---|---|
| UCC | 99999– | 104.437 | 3.23 | 0.185 | -0.197 | -0.308 | 51.398 |
| Li et al. | 2025 | 104.438 | 3.229 | 0.164 | -0.252 | -0.33 | – |
| Hu & Soubiran | 2025 | 104.402 | 3.261 | – | – | – | – |
| Almeida et al. | 2025 | 104.436 | 3.229 | – | – | – | – |
| Hunt & Reffert | 2024 | 104.437 | 3.228 | 0.176 | -0.218 | -0.314 | 46.406 |
| Cavallo et al. | 2024 | 104.402 | 3.261 | 0.178 | – | – | – |
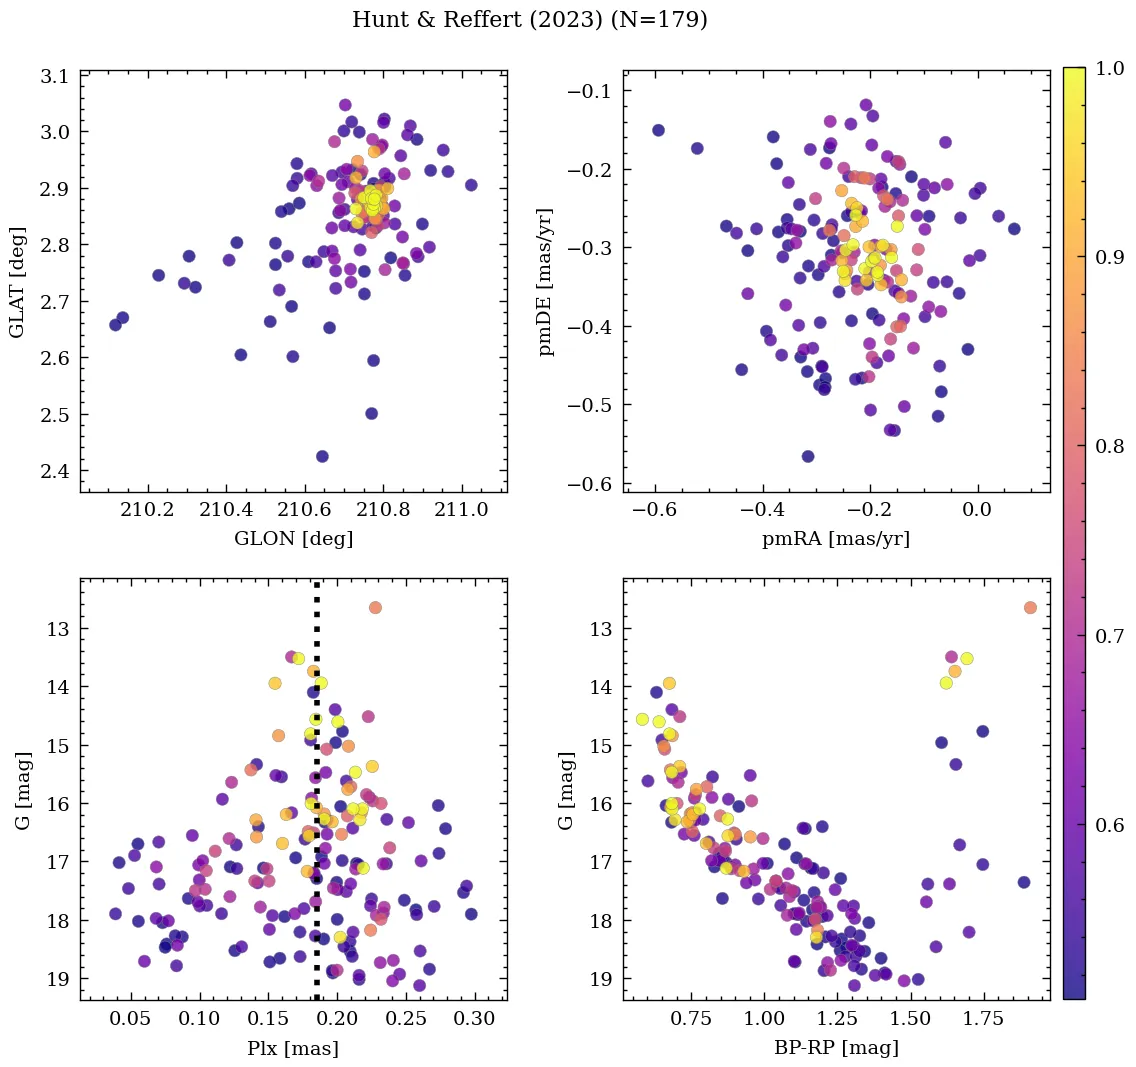
| Hunt & Reffert | 2023 | 104.437 | 3.228 | 0.176 | -0.218 | -0.314 | 46.406 |
| Almeida et al. | 2023 | 104.436 | 3.23 | – | – | – | – |
| Just et al. | 2023 | 104.442 | 3.219 | – | – | – | – |
| Jaehnig et al. | 2021 | 104.444 | 3.228 | 0.183 | -0.248 | -0.323 | – |
| Rain et al. | 2021 | 104.438 | 3.229 | 0.164 | -0.252 | -0.33 | – |
| Dias et al. | 2021 | 104.436 | 3.229 | 0.159 | -0.245 | -0.327 | – |
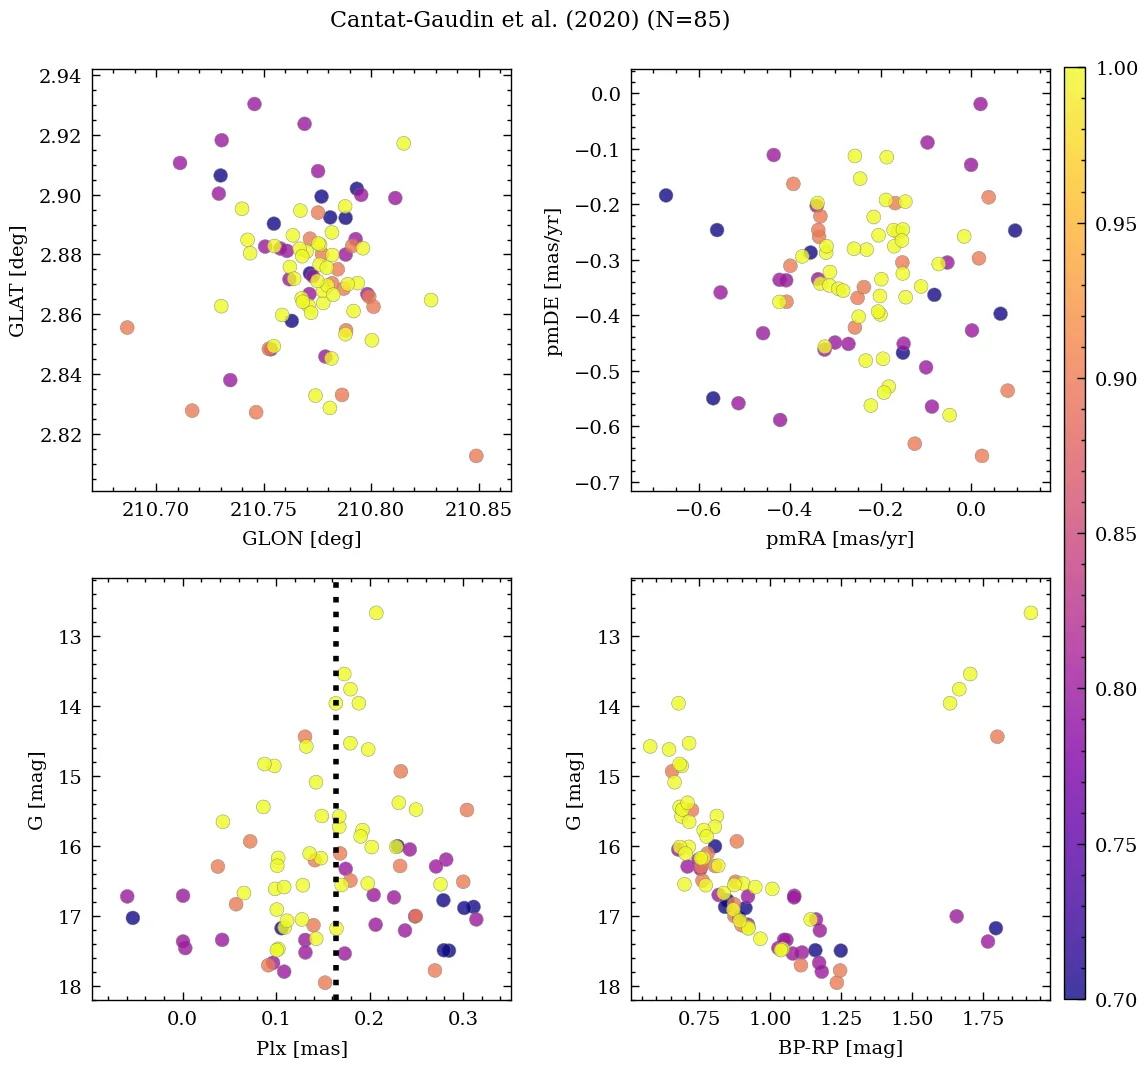
| Cantat-Gaudin et al. | 2020 | 104.438 | 3.229 | 0.164 | -0.252 | -0.33 | – |
| Zhong et al. | 2020 | 104.438 | 3.229 | – | -0.252 | -0.33 | 116.149 |
| Cantat-Gaudin & Anders | 2020 | 104.438 | 3.229 | 0.164 | -0.252 | -0.33 | – |
| Bica et al. | 2019 | 104.431 | 3.231 | – | – | – | – |
| Cantat-Gaudin et al. | 2018 | 104.438 | 3.229 | 0.164 | -0.252 | -0.33 | – |
| Loktin & Popova | 2017 | 104.43 | 3.218 | – | 0.547 | -0.267 | – |
| Kharchenko et al. | 2016 | 104.442 | 3.219 | – | – | – | – |
| Dias et al. | 2014 | 104.425 | 3.217 | – | -0.84 | -3.47 | – |
| Kharchenko et al. | 2013 | 104.449 | 3.217 | – | 1.27 | -0.75 | – |
| Gozha et al. | 2012 | 104.425 | 3.217 | – | – | – | – |
| Bukowiecki et al. | 2011 | 104.442 | 3.229 | – | – | – | – |
| Ahumada & Lapasset | 2007 | 104.425 | 3.217 | – | – | – | – |
| van den Bergh | 2006 | 104.425 | 3.217 | – | – | – | – |
| Dias et al. | 2002 | 104.425 | 3.217 | – | -0.84 | -3.47 | – |
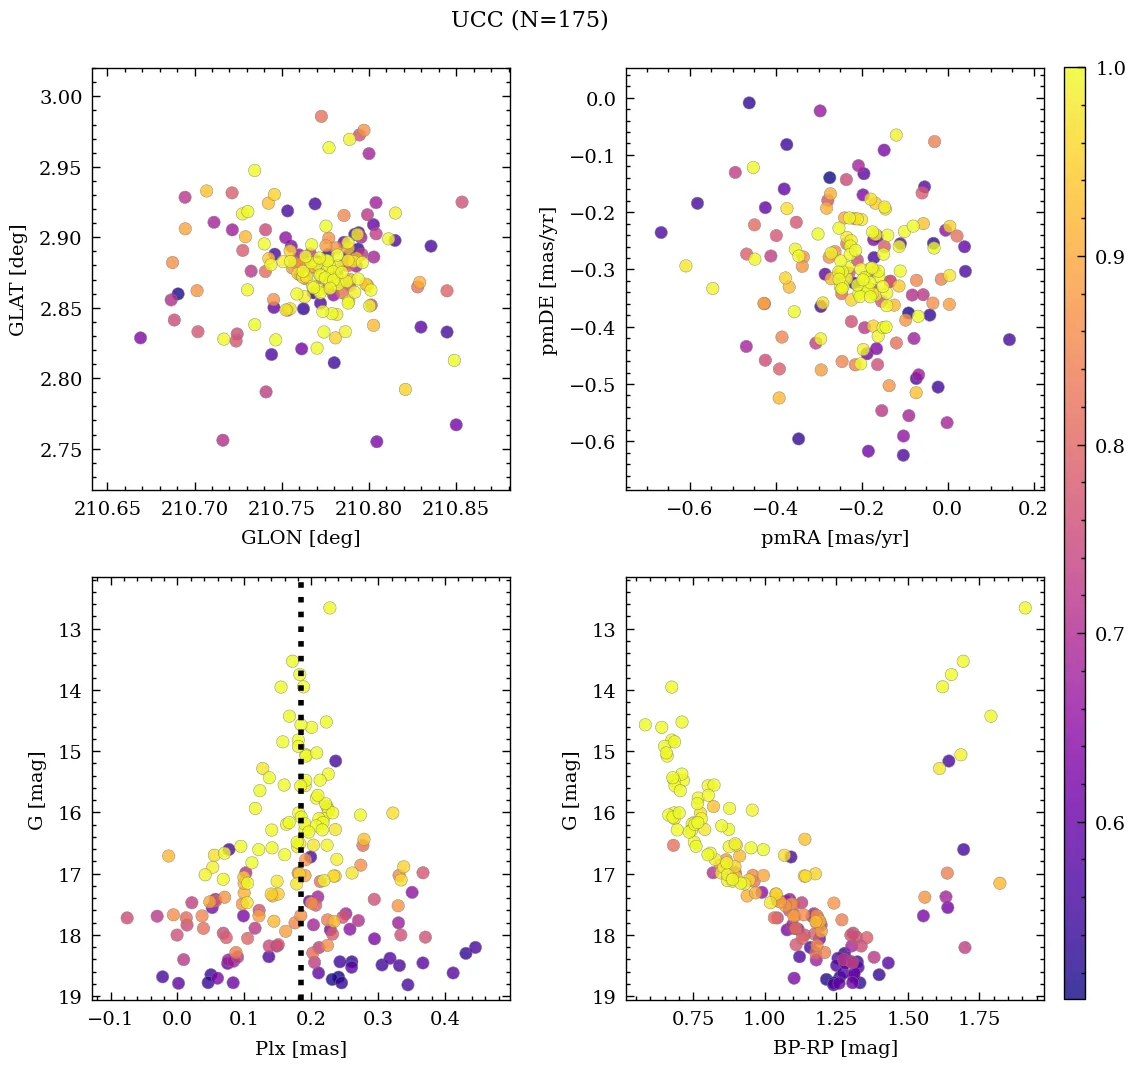
💡 Note: The UCC values are estimated from its identified members.
| Reference | Year | Dist [kpc] | Av [mag] | DAv [mag] | Age [Myr] | [Fe/H] [dex] | Mass [Msun] | Bfrac | BSS |
|---|---|---|---|---|---|---|---|---|---|
| UCC | 99999– | 4.98 | 1.58 | 1.7 | 427 | -0.178 | 1367 | 0.66 | 0 |
| Li et al. | 2025 | 4.41 | 1.55 | – | 430 | -0.157 | – | – | – |
| Hu & Soubiran | 2025 | – | – | – | – | -0.210(5) | – | – | – |
| Almeida et al. | 2025 | 4.15 | 1.57 | – | 455 | – | 732 | – | – |
| Hunt & Reffert | 2024 | – | – | – | – | – | 1367(1) | – | – |
| Cavallo et al. | 2024 | 3.24 | 1.60 | – | 759 | -0.580 | – | – | – |
| Hunt & Reffert | 2023 | 4.56 | 1.32 | 1.70 | 461 | – | – | – | – |
| Almeida et al. | 2023 | 4.09 | 1.60 | – | 439 | -0.199 | 909(1) | 0.66 | – |
| Just et al. | 2023 | – | – | – | 313 | – | 1945 | – | – |
| Spina et al. | 2022 | – | – | – | – | -0.106 | – | – | – |
| Jaehnig et al. | 2021 | 5.57(1) | – | – | – | – | – | – | – |
| Rain et al. | 2021 | 5.19 | 1.58 | – | 302 | – | – | – | 0 |
| Dias et al. | 2021 | 4.15 | 1.57 | – | 455 | -0.206 | – | – | – |
| Cantat-Gaudin et al. | 2020 | 5.40 | 1.27 | – | 295 | – | – | – | – |
| Kounkel et al. | 2020 | 4.98 | 1.35 | – | 427 | – | – | – | – |
| Zhong et al. | 2020 | 4.98 | 1.64 | – | 8495 | 0.000 | – | – | – |
| Cantat-Gaudin & Anders | 2020 | 5.19 | – | – | – | – | – | – | – |
| Cantat-Gaudin et al. | 2018 | 5.19 | – | – | – | – | – | – | – |
| Loktin & Popova | 2017 | 6.21 | 1.03 | – | 537 | – | – | – | – |
| Kharchenko et al. | 2016 | 4.98 | 1.64 | – | 313 | – | – | – | – |
| Kharchenko et al. | 2013 | 4.98 | 1.64 | – | 313 | – | – | – | – |
| Bukowiecki et al. | 2012 | – | – | – | – | – | 9501 | – | – |
| Gozha et al. | 2012 | 4.79 | – | – | 302 | 0.100 | – | – | – |
| Bukowiecki et al. | 2011 | 5.65(1) | 0.82 | – | 631 | – | – | – | – |
| Ahumada & Lapasset | 2007 | – | 1.58 | – | 302 | – | – | – | 1 |
| van den Bergh | 2006 | 4.79 | 1.58 | – | 302 | – | – | – | – |
| Dias et al. | 2002 | 4.79 | 1.58 | – | 302 | – | – | – | – |
(N): Indicates that there are N extra values assigned to this parameter in the corresponding reference.
Almeida et al. (2025)
Mass determination: good fit. Isochrone match: intermediate fit. Silver sample.
Cavallo et al. (2024)
Gold sample.
Hunt & Reffert (2024)
Classified as open cluster. CMD class: 0.98 (50th percentile).
Ahumada & Lapasset (2007)
Only straggler candidates inside a radius of 3' around the centre of coordinates have been considered.