Berkeley 26
(Biurakan 12; MWSC 994; OCL 520)
0.45
UTI
0.45
CN
0.09
Cdens
0.38
CC3
0.66
Clit
1.0
Cdup
Nm (P>50%)
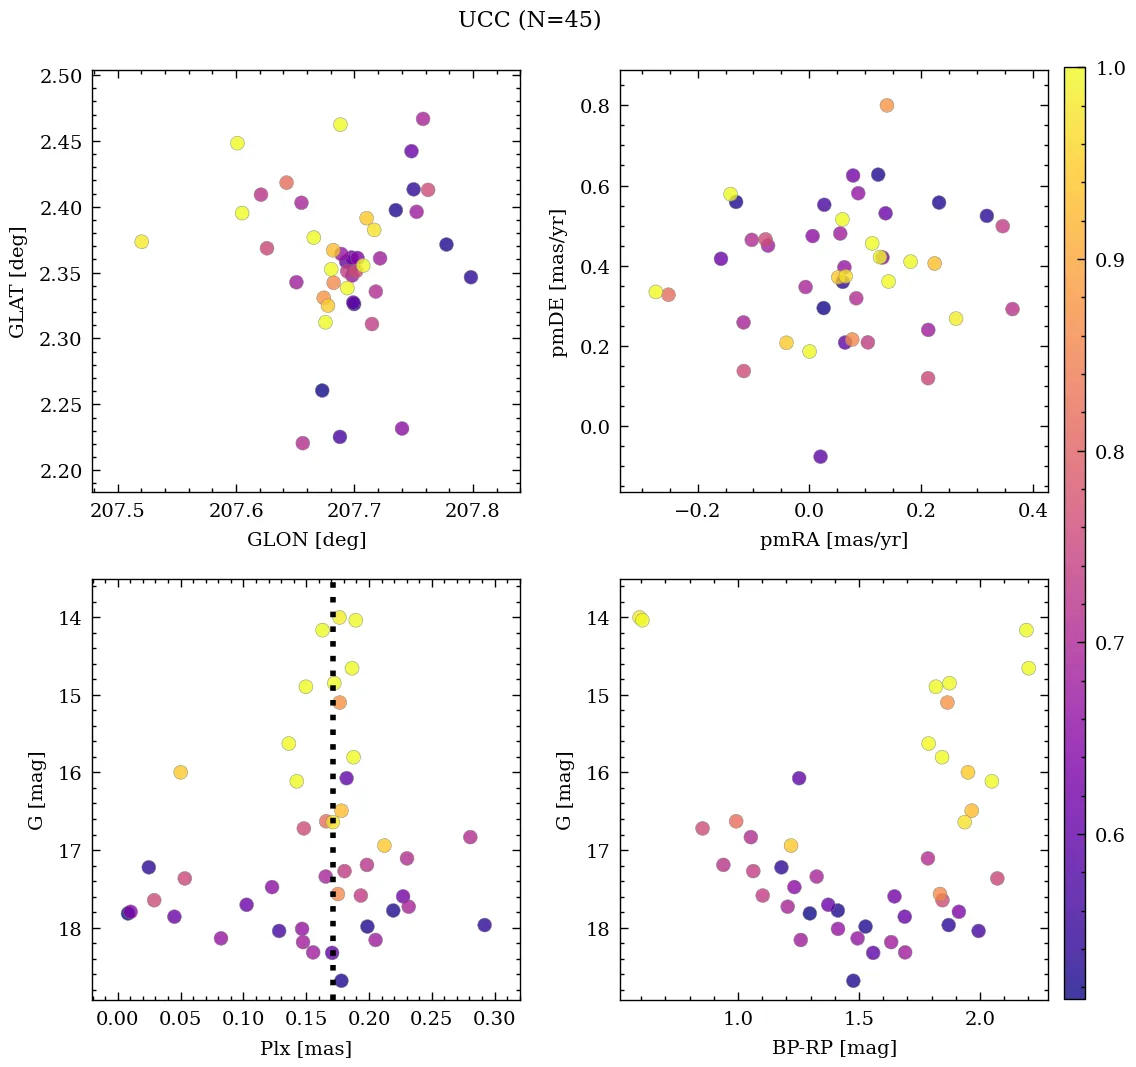
45
Core radius and density
4.0 [pc], 0.4 [pc-2]
- CN 0.45 Poorly populated
- Cdens 0.09 Very loose
- CC3 0.38 Low quality
- Clit 0.66 Moderately studied
- Cdup 1.0 Unique
 MOCA
MOCA
Overview
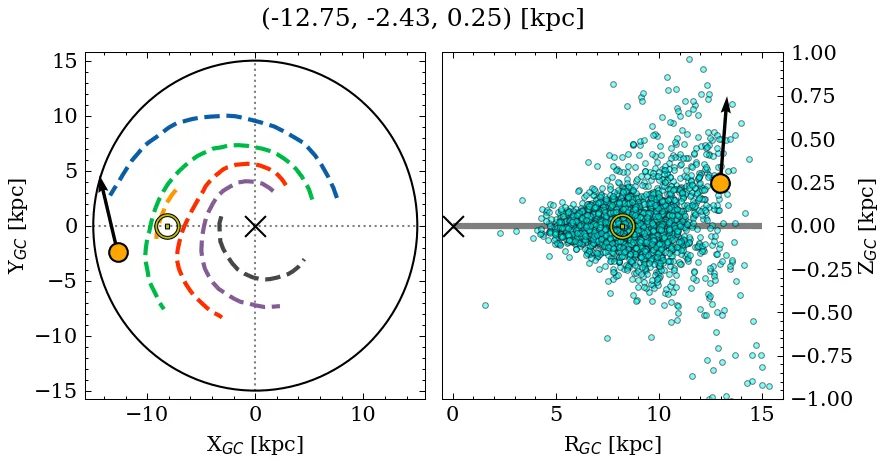
Berkeley 26 is a poorly populated, very loose object of low C3 quality. Its parallax locates it at a large distance, above the mid-plane, affected by moderate extinction. It is catalogued as a massive, metal-poor, old cluster, but with a large variance across recent sources for the age and mass parameters (see Parameters). It is moderately studied in the literature.
Note: This object contains blue stragglers according to at least one source.
Data
| Reference | Year | RA [deg] | DEC [deg] | Plx [mas] | pmRA [mas/yr] | pmDE [mas/yr] | Rv [km/s] |
|---|---|---|---|---|---|---|---|
| UCC | 99999– | 102.573 | 5.73 | 0.171 | 0.064 | 0.406 | 70.255 |
| Cui et al. | 2025 | 102.572 | 5.729 | 0.18 | 0.06 | 0.42 | – |
| He et al. | 2023 | 102.573 | 5.727 | 0.179 | 0.063 | 0.422 | 66.57 |
| Just et al. | 2023 | 102.54 | 5.757 | – | – | – | – |
| Perren et al. | 2022 | 102.547 | 5.755 | – | – | – | – |
| Bica et al. | 2019 | 102.564 | 5.736 | – | – | – | – |
| Dias et al. | 2018 | – | – | – | 0.11 | -2.89 | – |
| Loktin & Popova | 2017 | 102.57 | 5.751 | – | -0.978 | -0.908 | 68.0 |
| Sampedro et al. | 2017 | 102.575 | 5.75 | – | – | – | – |
| Dias et al. | 2016 | 102.575 | 5.75 | – | 2.7 | -1.44 | 68.0 |
| Kharchenko et al. | 2016 | 102.54 | 5.757 | – | – | – | – |
| Netopil et al. | 2016 | 102.547 | 5.755 | – | – | – | – |
| Tadross | 2014 | 102.575 | 5.75 | – | – | – | – |
| Dias et al. | 2014 | 102.575 | 5.75 | – | 2.7 | -1.44 | – |
| Kharchenko et al. | 2013 | 102.547 | 5.755 | – | -4.12 | -2.98 | – |
| Gozha et al. | 2012 | 102.575 | 5.75 | – | – | – | – |
| Bukowiecki et al. | 2011 | 102.558 | 5.732 | – | – | – | – |
| Dias et al. | 2002 | 102.575 | 5.75 | – | – | – | – |
| Lynga | 1987 | 102.568 | 5.771 | – | – | – | – |
| Alter et al. | 1970 | 102.564 | 5.758 | – | – | – | – |
💡 Note: The UCC values are estimated from its identified members.
| Reference | Year | Dist [kpc] | Av [mag] | DAv [mag] | Age [Myr] | [Fe/H] [dex] | Mass [Msun] | Bfrac | BSS |
|---|---|---|---|---|---|---|---|---|---|
| UCC | 99999– | 4.625 | 1.71 | – | 1882 | -0.525 | 2368 | 0.78 | 20 |
| Cui et al. | 2025 | – | 2.00 | – | 4467 | – | – | – | 20(1) |
| He et al. | 2023 | 4.68 | 2.00 | – | 3981 | – | – | – | – |
| Just et al. | 2023 | – | – | – | 513 | – | 136 | – | – |
| Perren et al. | 2022 | 4.57 | 1.74 | – | 8710 | 0.070 | 4600 | 0.78 | – |
| Loktin & Popova | 2017 | 3.58 | 1.35 | – | 891 | – | – | – | – |
| Dias et al. | 2016 | 12.59 | 2.37 | – | 3981 | -0.350 | – | – | – |
| Kharchenko et al. | 2016 | 2.72 | 1.71 | – | 513 | – | – | – | – |
| Netopil et al. | 2016 | 12.13 | – | – | 1770 | – | – | – | – |
| Tadross | 2014 | 2.72 | 1.70 | – | 600 | – | – | – | – |
| Kharchenko et al. | 2013 | 2.72 | 1.71 | – | 513 | -0.700 | – | – | – |
| Gozha et al. | 2012 | 12.59 | – | – | 3981 | -0.700 | – | – | – |
| Bukowiecki et al. | 2011 | 8.16(1) | 1.58 | – | 1995 | – | – | – | – |
(N): Indicates that there are N extra values assigned to this parameter in the corresponding reference.
Perren et al. (2022)
The cluster appears as a weak overdensity against the background field. The RDP gives a radius near 2', but the TO is diffuse due to scatter and BSS candidates, and the giant branch is even less prominent. ASteCA sets the TO at G=18.5, resulting in a distance of 4.6 kpc and an age of 8.6 Gyr. Piatti 2010 reports 4.3 kpc and 4 Gyr — the distances are close, but the age difference is substantial, likely because ASteCA sets the TO almost half a magnitude fainter due to a large binary fraction (~70%). WEBDA and MWSC give 4.3 and 2.7 kpc; MWSC assigns a very young age of ~0.5 Gyr. The OC02 distance of 12.5 kpc appears to be a database recording error.