Berkeley 22
(MWSC 698; OCL 490)
0.95
UTI
0.86
CN
1.0
Cdens
1.0
CC3
0.95
Clit
1.0
Cdup
Nm (P>50%)
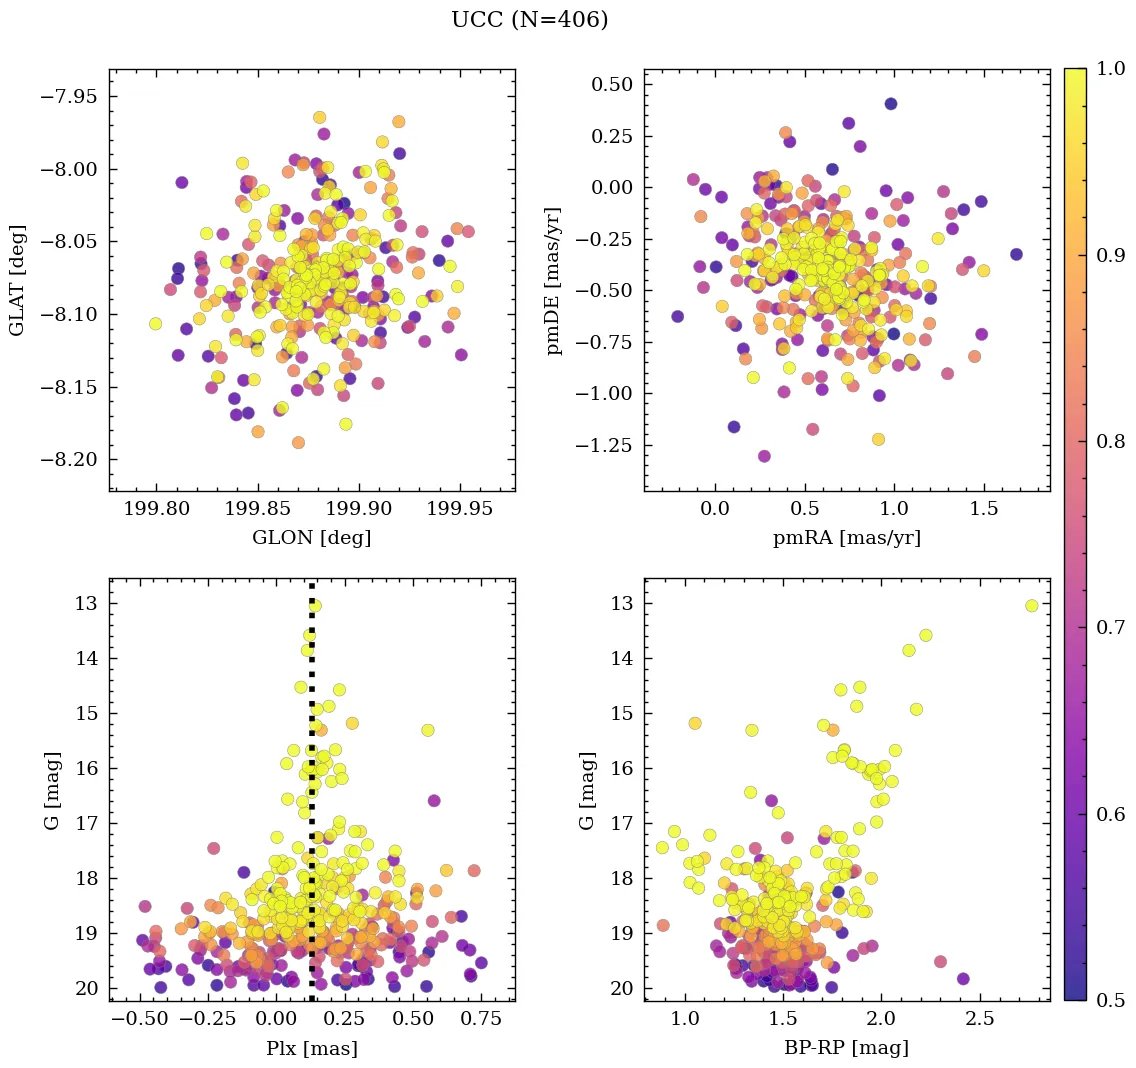
406
Core radius and density
1.5 [pc], 9.6 [pc-2]
- CN 0.86 Rich
- Cdens 1.0 Very dense
- CC3 1.0 Very high quality
- Clit 0.95 Very well-studied
- Cdup 1.0 Unique
 MOCA
MOCA
Overview
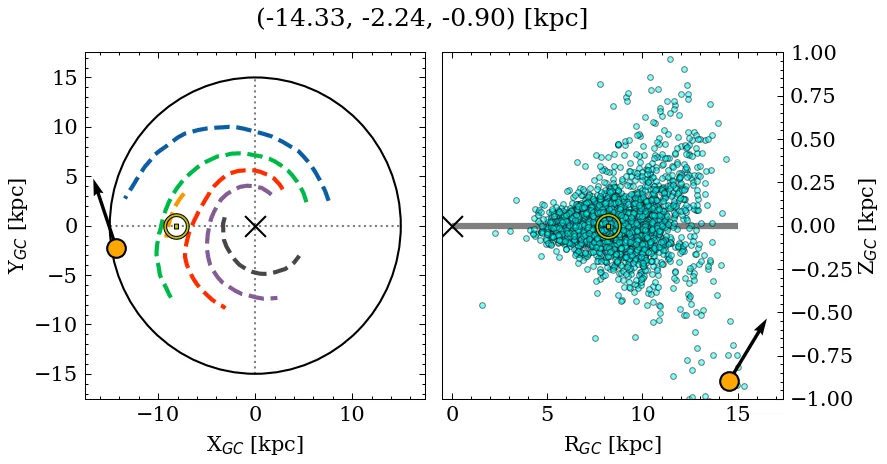
Berkeley 22 is a rich, very dense object of very high C3 quality. Its parallax locates it at a large distance, well below the mid-plane, affected by moderate extinction. It is catalogued as a massive, near-solar metallicity, old cluster, but with a large variance across recent sources for the age and mass parameters (see Parameters). It is very well-studied in the literature.
Note: This object contains blue stragglers according to at least one source.
Note: This object shares a very small percentage of members with a later reported entry. See table with shared members information.
Data
| Reference | Year | RA [deg] | DEC [deg] | Plx [mas] | pmRA [mas/yr] | pmDE [mas/yr] | Rv [km/s] |
|---|---|---|---|---|---|---|---|
| UCC | 99999– | 89.615 | 7.757 | 0.13 | 0.629 | -0.404 | 90.907 |
| Otto et al. | 2026 | 89.615 | 7.759 | – | 0.65 | -0.47 | 94.8 |
| Guerco et al. | 2025 | 89.6 | 7.76 | 0.15 | 0.61 | -0.37 | 95.3 |
| Hu & Soubiran | 2025 | 89.617 | 7.753 | – | – | – | – |
| Hunt & Reffert | 2024 | 89.615 | 7.759 | 0.134 | 0.564 | -0.39 | 87.412 |
| Cavallo et al. | 2024 | 89.617 | 7.753 | 0.148 | – | – | – |
| Hunt & Reffert | 2023 | 89.615 | 7.759 | 0.134 | 0.564 | -0.39 | 87.412 |
| Just et al. | 2023 | 89.624 | 7.758 | – | – | – | – |
| Jadhav & Subramaniam | 2021 | 89.618 | 7.763 | – | – | – | – |
| Jaehnig et al. | 2021 | 89.623 | 7.764 | 0.1 | 0.616 | -0.456 | – |
| Netopil et al. | 2022 | 89.612 | 7.756 | – | – | – | 94.31 |
| Rain et al. | 2021 | 89.618 | 7.763 | 0.069 | 0.648 | -0.473 | – |
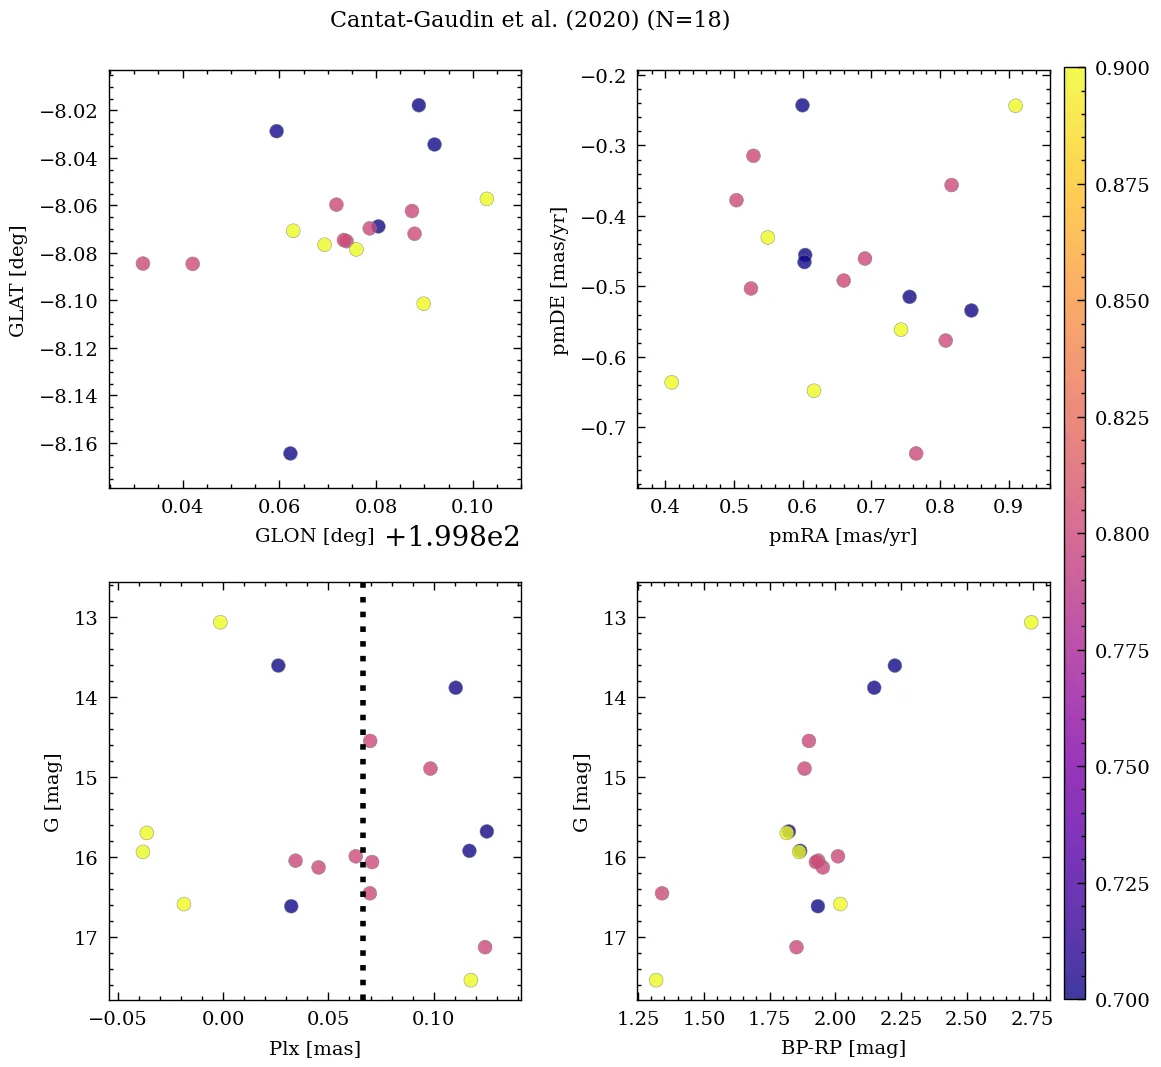
| Cantat-Gaudin et al. | 2020 | 89.618 | 7.763 | 0.069 | 0.648 | -0.473 | – |
| Zhong et al. | 2020 | 89.618 | 7.763 | – | 0.648 | -0.473 | 97.289 |
| Cantat-Gaudin & Anders | 2020 | 89.618 | 7.763 | 0.069 | 0.648 | -0.473 | – |
| Soubiran et al. | 2018 | 89.618 | 7.763 | – | – | – | 92.45 |
| Bica et al. | 2019 | 89.622 | 7.758 | – | – | – | – |
| Cantat-Gaudin et al. | 2018 | 89.618 | 7.763 | 0.069 | 0.648 | -0.473 | – |
| Loktin & Popova | 2017 | 89.61 | 7.757 | – | 0.395 | -1.002 | 95.3 |
| Dias et al. | 2016 | 89.612 | 7.757 | – | 1.81 | -3.93 | 95.3 |
| Kharchenko et al. | 2016 | 89.624 | 7.758 | – | – | – | – |
| Netopil et al. | 2016 | 89.6 | 7.833 | – | – | – | – |
| Kharchenko et al. | 2013 | 89.631 | 7.757 | – | 1.81 | -3.93 | 95.3 |
| Gozha et al. | 2012 | 89.613 | 7.757 | – | – | – | – |
| Bukowiecki et al. | 2011 | 89.617 | 7.76 | – | – | – | – |
| Kharchenko et al. | 2007 | 89.61 | 7.76 | – | 0.01 | – | – |
| Ahumada & Lapasset | 2007 | 89.6 | 7.833 | – | – | – | – |
| van den Bergh | 2006 | 89.6 | 7.833 | – | – | – | – |
| Chen et al. | 2003 | 89.601 | 7.837 | – | – | – | – |
| Dias et al. | 2002 | 89.6 | 7.833 | – | – | – | – |
| Lynga | 1987 | 89.601 | 7.837 | – | – | – | – |
| Alter et al. | 1970 | 89.601 | 7.837 | – | – | – | – |
💡 Note: The UCC values are estimated from its identified members.
| Reference | Year | Dist [kpc] | Av [mag] | DAv [mag] | Age [Myr] | [Fe/H] [dex] | Mass [Msun] | Bfrac | BSS |
|---|---|---|---|---|---|---|---|---|---|
| UCC | 99999– | 6.92 | 1.97 | 2.54 | 2455 | -0.300 | 1410 | – | 3 |
| Otto et al. | 2026 | – | – | – | 2455 | -0.310(15) | – | – | – |
| Guerco et al. | 2025 | – | – | – | 2450 | -0.330 | – | – | – |
| Hu & Soubiran | 2025 | – | – | – | – | -0.300(5) | – | – | – |
| Hunt & Reffert | 2024 | 5.26 | 1.81 | 2.54 | 789 | – | 1410(1) | – | – |
| Cavallo et al. | 2024 | 6.22 | 1.52 | – | 2884 | -0.260 | – | – | – |
| Hunt & Reffert | 2023 | 5.26 | 1.81 | 2.54 | 789 | – | – | – | – |
| Just et al. | 2023 | – | – | – | 3162 | – | 703 | – | – |
| Spina et al. | 2022 | – | – | – | – | -0.333 | – | – | – |
| Jadhav & Subramaniam | 2021 | 6.22 | 1.99 | – | 2455 | – | 2365 | – | 1(1) |
| Jaehnig et al. | 2021 | 9.69(1) | – | – | – | – | – | – | – |
| Netopil et al. | 2022 | 6.92(1) | – | – | 2512 | -0.240(1) | – | – | – |
| Rain et al. | 2021 | 10.15 | 1.86 | – | 3311 | – | – | – | 3 |
| Cantat-Gaudin et al. | 2020 | 6.22 | 1.99 | – | 2455 | – | – | – | – |
| Kounkel et al. | 2020 | 5.74 | 1.83 | – | 1995 | – | – | – | – |
| Zhong et al. | 2020 | 10.15(1) | – | – | – | 0.000 | – | – | – |
| Cantat-Gaudin & Anders | 2020 | 10.15 | – | – | – | – | – | – | – |
| Soubiran et al. | 2018 | 10.15 | – | – | – | – | – | – | – |
| Cantat-Gaudin et al. | 2018 | 10.15 | – | – | – | – | – | – | – |
| Loktin & Popova | 2017 | 7.32 | 2.24 | – | 995 | – | – | – | – |
| Dias et al. | 2016 | 6.00 | 1.86 | – | 3311 | -0.320 | – | – | – |
| Kharchenko et al. | 2016 | 5.49 | 1.97 | – | 3162 | – | – | – | – |
| Netopil et al. | 2016 | 13.87 | – | – | 3070 | -0.240(2) | – | – | – |
| Heiter et al. | 2014 | – | – | – | – | -0.240 | – | – | – |
| Kharchenko et al. | 2013 | 5.49 | 1.97 | – | 3162 | -0.320 | – | – | – |
| Gozha et al. | 2012 | 6.00 | – | – | 3311 | -0.320 | – | – | – |
| Bukowiecki et al. | 2011 | 6.18(1) | 1.83 | – | 3162 | – | – | – | – |
| Paunzen et al. | 2010 | – | – | – | – | -0.420 | – | – | – |
| Ahumada & Lapasset | 2007 | – | 2.21 | – | 1072 | – | – | – | 21 |
| van den Bergh | 2006 | 7.66 | 2.21 | – | 1072 | – | – | – | – |
| Chen et al. | 2003 | 7.66 | 2.21 | – | 1060 | -0.300(1) | – | – | – |
| Dias et al. | 2002 | 7.66 | 2.21 | – | 1064 | -0.300 | – | – | – |
(N): Indicates that there are N extra values assigned to this parameter in the corresponding reference.
Cavallo et al. (2024)
Gold sample.
Hunt & Reffert (2024)
Classified as open cluster. CMD class: 0.12 (50th percentile).
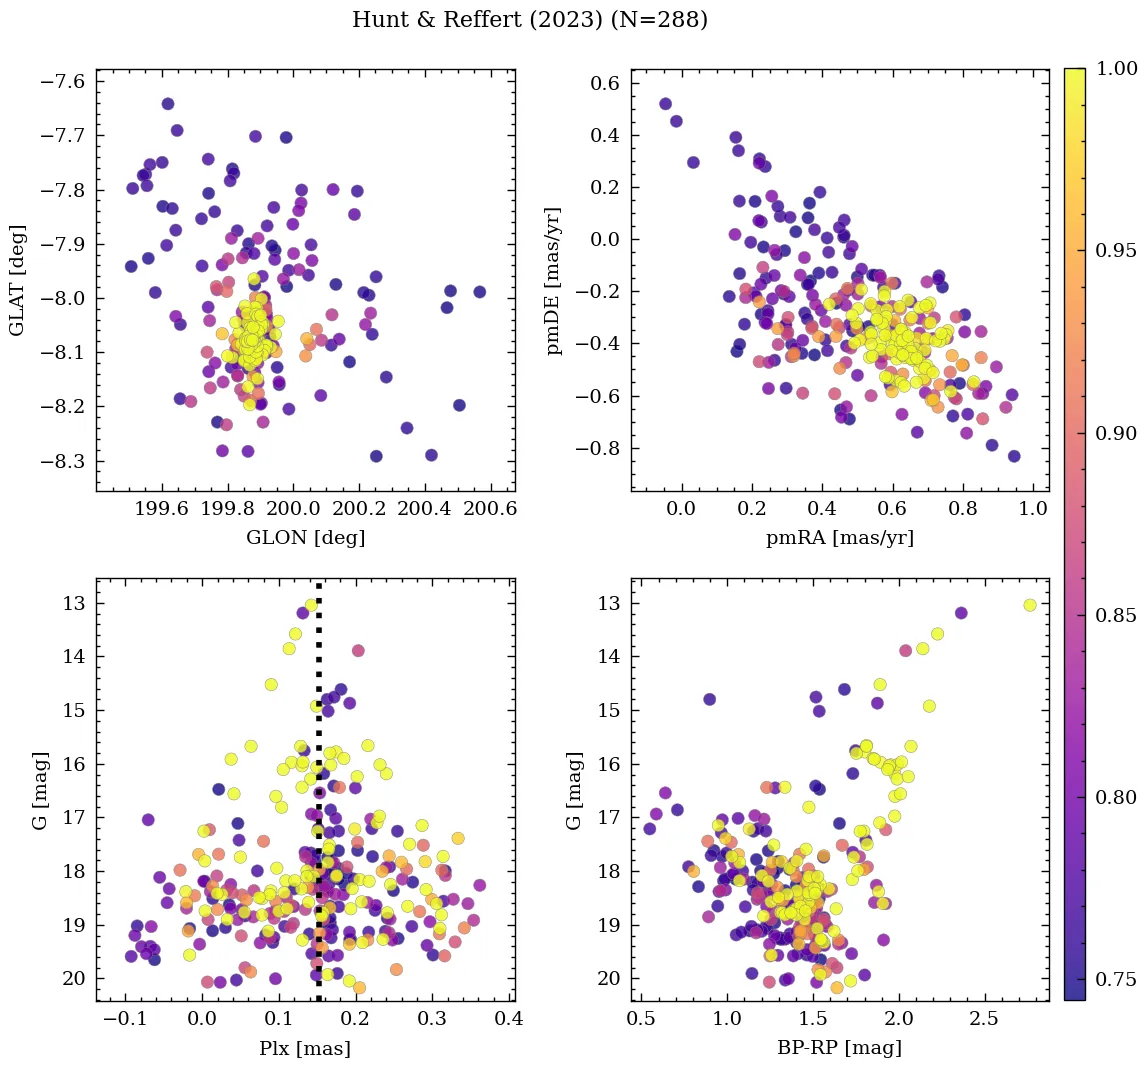
Hunt & Reffert (2023)
Classified as open cluster. CMD class: 0.12 (50th percentile).
Hu et al. (2021)
Ellipticities (core, all): e_core=0.3394, e_all=0.2086.
Rain et al. (2021)
The red limit of the straggler area is BP-RP=1.55.
Ahumada & Lapasset (2007)
The red limit of the blue straggler area is (B-V)=1.06. In (1994A&AS..108..151K) it is remarked that most of the straggler candidates are near the cluster centre; however, if the apparent diameter given in (1987, Lund Catalogue of Open Cluster Data), which is the one listed in Table 1, is taken as correct, the stragglers do not appear so central. It is possible that this diameter is still too small.